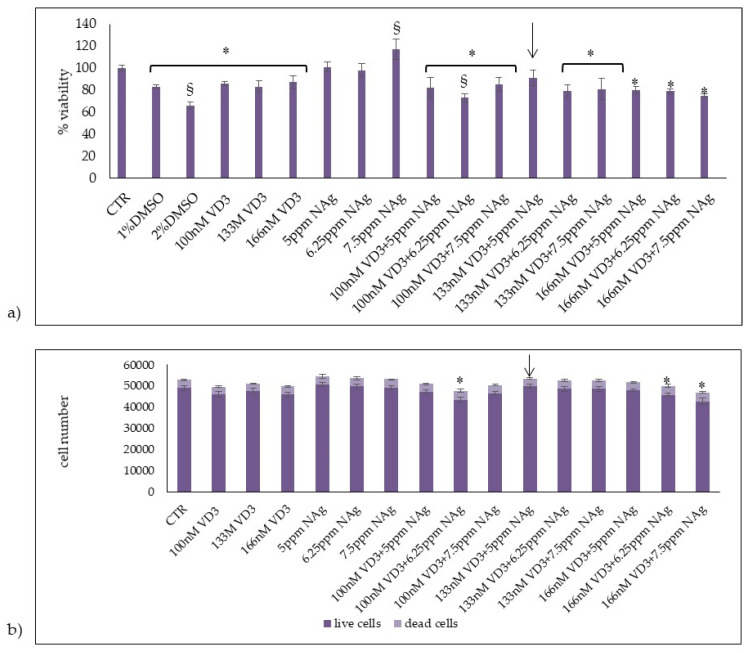
Figure 1.
Effect of VD3, AgNPs (NAg), and their combination in HaCaT cells. Cells were cultured and treated as reported in Section 4. (a) Cell viability was measured by MTT assay. Values are reported as percentage viability of the control sample; 1% DMSO and 2% DMSO were used as positive controls. (b) Live and dead cell number were measured by trypan blue exclusion assay. Data are expressed as mean ± SD of three independent experiments performed in duplicate. Significance, * p < 0.05 versus the control sample analyzed by t test and § p < 0.05 analyzed by ANOVA coupled with Bonferroni post hoc test.

