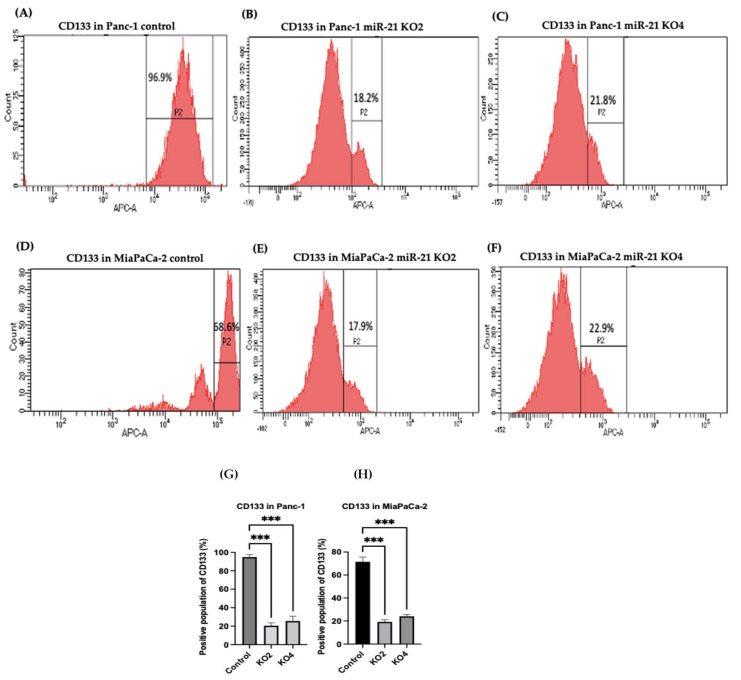
Figure 5.
Flow cytometry analysis of CD133 in PDAC control and miR-21 KO cell lines. (A–C): Expression of CD133 in the Panc-1 miR-21 Kos and control: (A) Panc-1 vector alone (control cells); (B) miR-21 KO2; (C) miR-21 KO4. (D–F): Expression of CD133 in MiaPaCa-2 miR-21 Kos. (D) MiaPaCa-2 vector alone (control cells); € miR-21 KO2; (F) miR-21 KO4. (G) Percentage of the CD133 positive population in Panc-1 cells and their miR-21 KOs. CD133 expression was significantly increased in the Panc-1 vector alone compared with the miR-21 KOs in the Panc-1 cell line. The column graphic represents the average of three replicates of RNA isolated from Panc-1 control cells and their KOs. Data normalized according to RPII expression by fold analysis (n = 3, p < 0.05). (H) Percentage of the CD133 positive population in MiaPaCa-2 cells and their miR-21 KOs. CD133 expression was significantly increased in MiaPaCa-2 control cells compared with their miR-21 KOs. The column graphic represents the average of three replicates of RNA isolated from MiaPaCa-2 control cells and their KOs. Data normalized according to RPII expression by fold analysis (n = 3, p < 0.05). Numbers in the gated areas mark the percentages of cells that were positive for this specific marker. p-values are indicated as *** p ≤ 0.001; error bars indicate SD.

