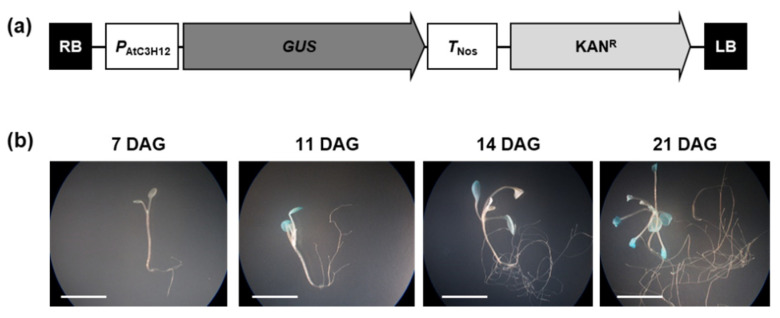
Figure 8.
Analysis of the promoter activity of AtC3H12. (a) Schematic map of PAtC3H12::GUS for GUS assay. (b) Histochemical assay of GUS activities in transgenic plants harboring PAtC3H12::GUS at different developmental stages grown under SD conditions. Three independent T1 lines showed similar results, with one shown here. The white lines indicate scale bar = 1 cm.

