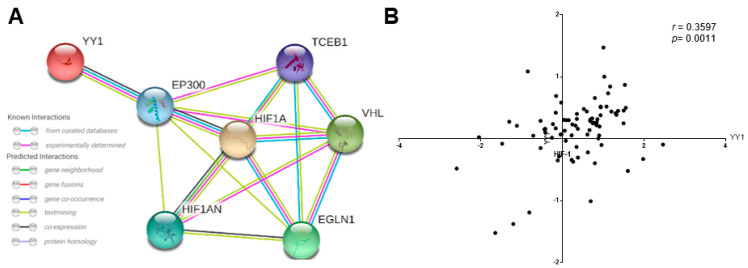
Figure 6.
Gene expression and correlation of HIF-1α and YY1 in ALL. (A) Network analysis between HIF-1α/YY1. The Search Tool for the Retrieval of Interacting Genes (STRING) database [32], was used to visualize biological networks and integrate data of the protein–protein interaction between HIF-1α and YY1 [33]. The version 11.0 of STRING (Academic Consortium) was employed to seek for the protein–protein interaction (PPI), data limited to Homo Sapiens and a confidence score >0.4. (B) Analysis of HIF-1α and YY1 expression levels in several subtypes of ALL was performed using a public dataset of microarrays retrieved from the Oncomine database and the Gene Expression Omnibus NCBI gene expression and hybridization array data repository, obtained from an analysis from Anderson et al. [34]. According with OncomineTM the results shown that HIF-1α expression levels correlated with YY1 expression (*** p < 0.0001, r = 0.468, Pearson Analysis).

