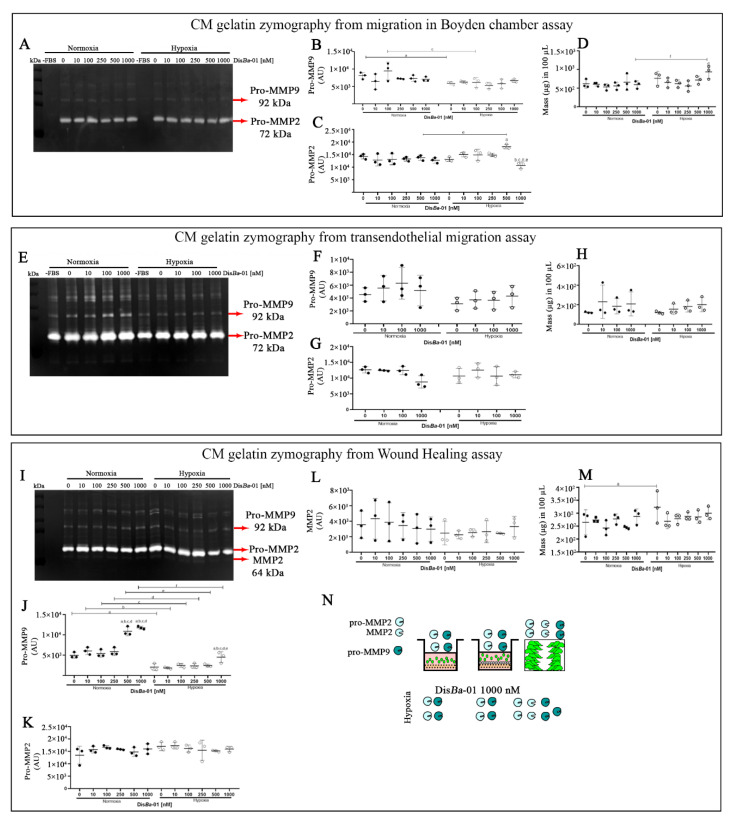
Figure 2.
MMP-2 and MMP-9 levels in the conditioned media (CM) from MDA-MB-231 cell migration assays. (A,E,I) Representative zymographs of CM from transwell, transmigration, and wound healing assays; (B,F,J) Quantification of pro-MMP-9 levels by densitometry; (C,G,K,L) Quantification of pro-MMP-2 and active MMP-2 levels by densitometry; (D,H,M), CM total protein concentration. (N) Graphical summary of the assays. Experiments were performed in triplicate with three independent assays (n = 3). The results (mean ± SD) were compared using two-way ANOVA followed by Tukey’s test (p < 0.05). Graphic letters a, b, c, d, and e represent comparisons among 0, 10,100, 250, 500, and 1000 nM of DisBa-01, respectively.

