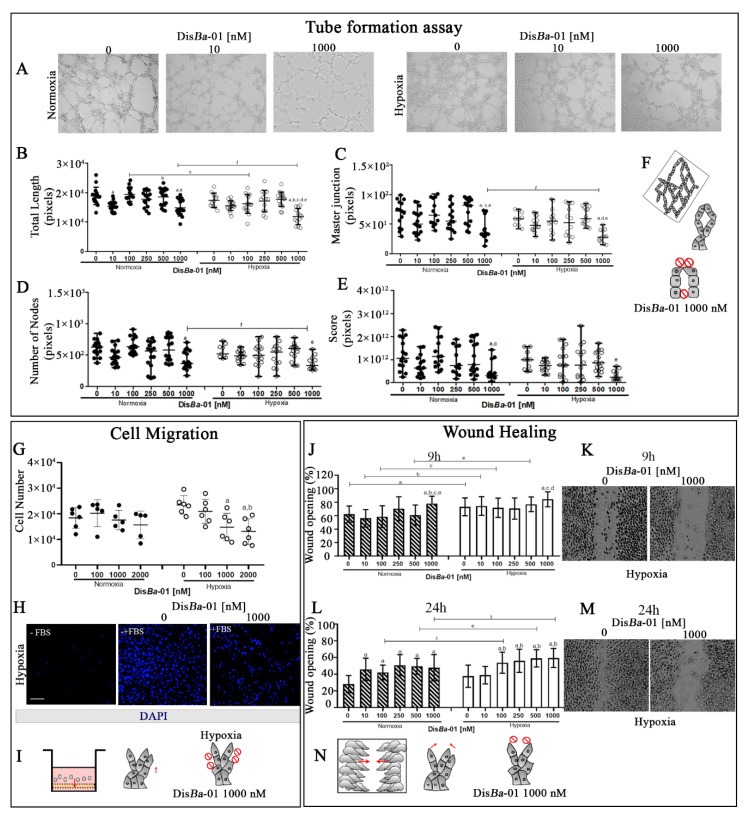
Figure 3.
Inhibition of tube formation and cell migration of DisBa-01-treated HUVECs in normoxia and hypoxia. (A–F) Tube formation assay. Representative images of HUVECs in the indicated conditions (A), total length (B), master junctions (C), number of nodes (D), and score (E) by pixel quantification of DisBa-01-treated HUVECs in the two oxygen conditions. Experiments were performed in triplicate of three independent assays (n = 3, p < 0.05). (F) Graphical summary of the assay. (G–H), Boyden chamber migration assay of DisBa-01-treated HUVECs. Values were compared to negative control (without chemoattractant) (G). Representative images of migrating cells treated or not with DisBa-01 in hypoxia (H). Scale bar: 100 µm. (J–N) HUVEC wound healing assay. Percentage (mean ± SD) of wound opening in indicated concentrations of DisBa-01 in normoxia and hypoxia after 9 and 24 h (J,L). Representative images of scratches in hypoxia (K,M). (I,N) Graphical summary of the two migration assays. Graphic letters a, b, c, d, e, and f represent comparisons between 0, 10,100, 250, 500, and 1000 nM of DisBa-01, respectively. All experiments were performed in triplicate from three independent assays (n = 3, p < 0.05). Red arrows in graphical summary represent the direction of migration.

