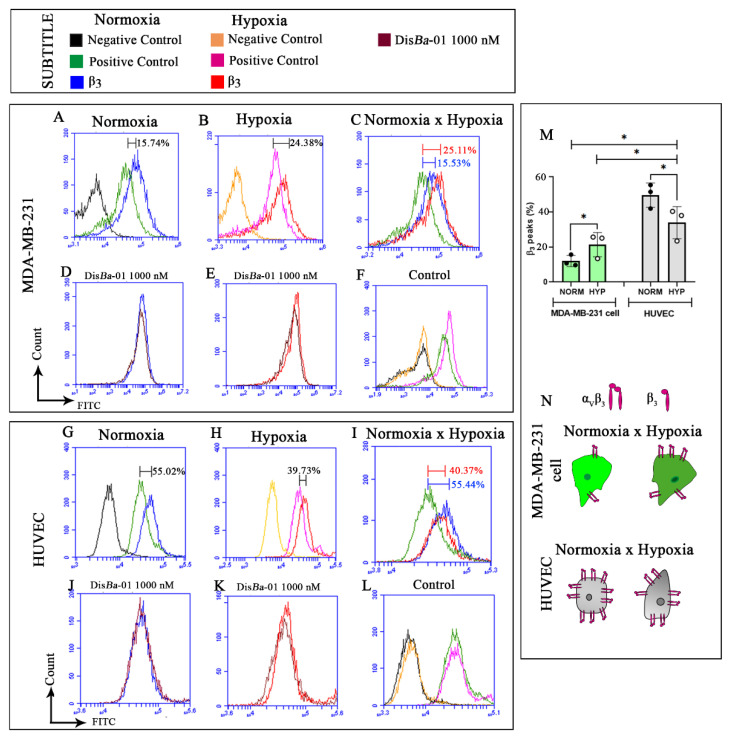
Figure 4.
Profile of β3 integrin subunit in MDA-MB-231 and HUVECs in normoxia and hypoxia. (A–F) Detection of β3 integrin subunit in MDA-MB-231 cells in normoxia (A), in hypoxia (B), and merge of (A) and (B) (C). Detection of β3 integrin in MDA-MB-231 cells after DisBa-01 treatment in normoxia (D), and in hypoxia (E), and negative and positive controls in normoxia and hypoxia (F). (G–L) Detection of β3 integrin subunit in HUVECs in normoxia (G), in hypoxia (H), and merge of (G) and (H); (I) HUVEC β3 integrin content after DisBa-01 treatment in normoxia (J) and in hypoxia (K), and negative and positive controls in normoxia and hypoxia (L). (M) Data quantification and statistics for MDA-MB-231 cells and HUVECs under normoxia and hypoxia. * means statistical differences between MDA-MB-231 cells (green bars) and HUVEC (gray bars) in normoxia and hypoxia. (N) Graphical summary of β3 integrin subunit profile in MDA-MB-231 cells and HUVECs with or without DisBa-01 in normoxia and hypoxia. Experiments were performed in triplicate from three independent assays (n = 3, p < 0.05).

