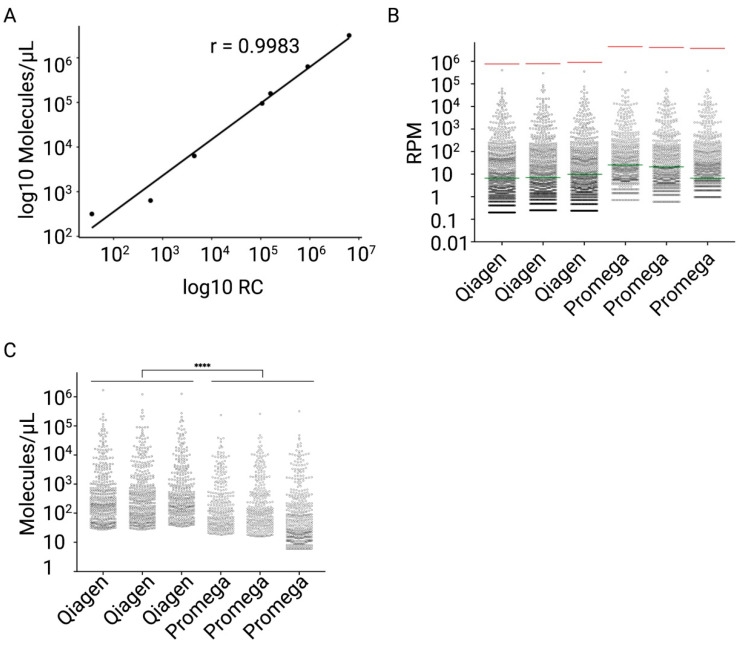
Figure 3.
Testing of the miND spike-in. Aliquots of a plasma pool were processed either with Qiagen or Promega RNA extraction protocols in triplicates. The generated RNA samples were analysed with the miND assay. (A) Scatter plot of relative miND spike-in (RC) compared to absolute miND spike-in levels (molecules detected per microliter of RNA) in Promega-extracted sample (Replicate 01). Pearson correlation coefficient r as well as the line that represents a linear model derived from the plotted values were calculated. (B) Distribution of RPM values of the endogenous microRNAs in the Qiagen- and Promega-extracted samples (3 replicates per protocol). The miND spike-ins with the highest (I, 50 amol) and the lowest (E, 0.005 amol) concentrations were indicated with red and green lines on the plot. (C) Distribution of absolute concentrations (molecules per microliter of RNA) of the endogenous microRNAs in the Qiagen- and Promega-extracted samples (3 replicates per protocol). The average values of molecules/µL for each sample were calculated, and an unpaired t-test comparison for Qiagen- and Promega-extracted samples was performed (p-value < 0.0001, p-value summary ****).

