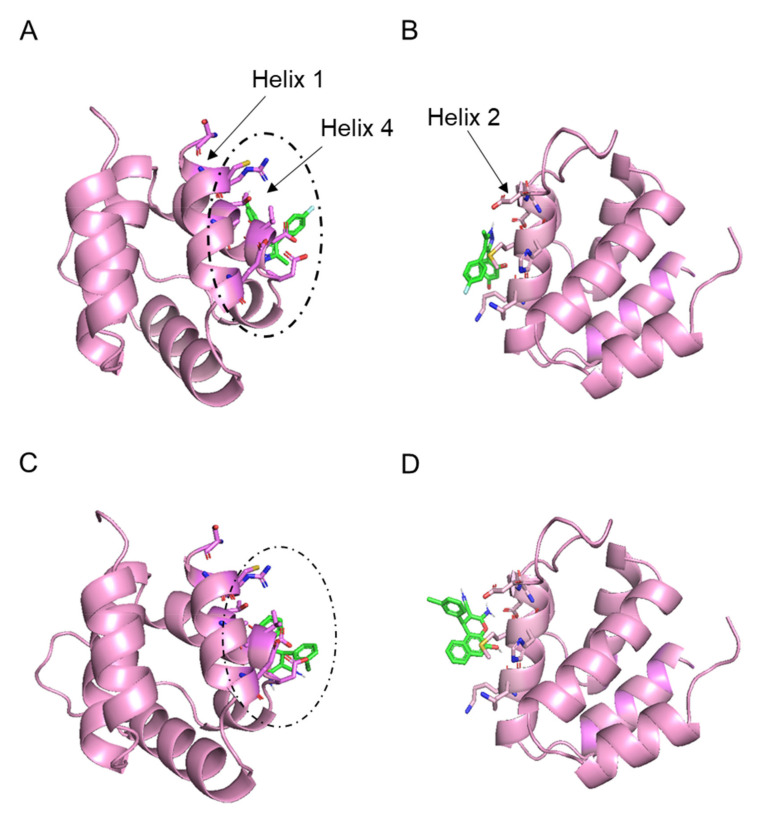
Figure 2.
Graphical representation of docking study between NLRP3PYD and (A,B) QM380, (C,D) QM381 (first poses) at the Ιa (A,C) and Ιb (B,D) interfaces, generated by Autodock Vina. In the peptide structures represented in cartoon form, residues that participated in the Ιa (helices 1 and 4) and Ιb (helix2) interfaces and ligands are in stick representation visualized by PYMOL (version.2.3.3).

