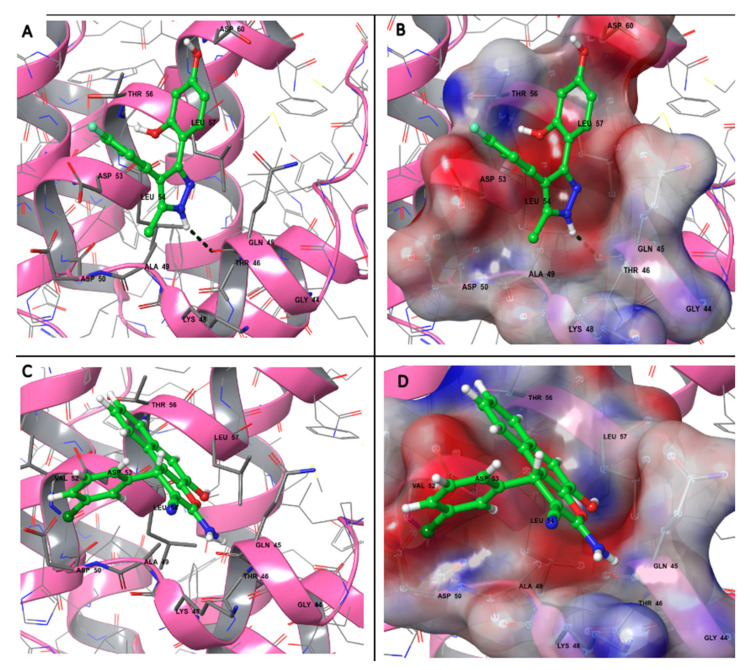
Figure 3.
Molecular interactions and electrostatic surface potential of predicted binding models at the binding site (residues with 5 A° distance to the ligand) for (A,B) QM380 and (C,D) QM381. The residues that interact are labeled, visualized in the ball–stick model, and colored based on their physicochemical properties. The hydrogen bond of Gln 45 and QM380 is shown as a dashed line. In panels (B,D), the surface ranges are characterized from positive electrostatic potential (blue surface) to a negative potential (red surface) with 30% transparency. The structures and interfaces were represented and analyzed by Maestro (version 12.6).

