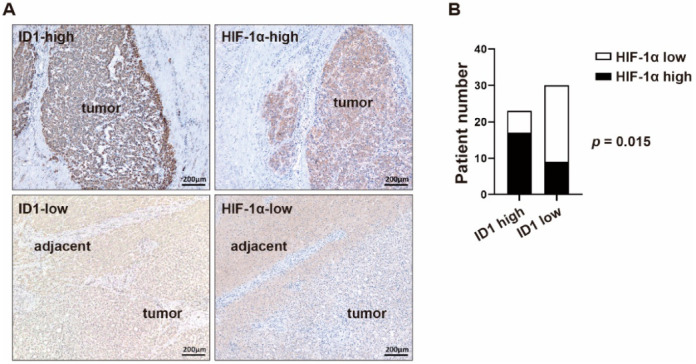
Figure 3.

The correlation of ID1 and HIF-1α in clinical samples. (A) Representative IHC staining images of ID1/HIF-1α-high (upper panel) and ID1/HIF-1α-low (lower panel) surgically resected HCC tissue specimens. (B) Correlation of ID1 and HIF-1α in HCC patient samples. The p value was calculated by the chi-squared test.
