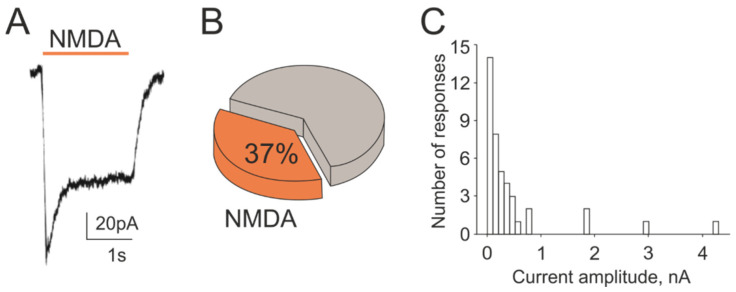
Figure 5.
NMDA-evoked membrane currents in rat TG neurons: (A) Representative membrane current traces activated by NMDA (100 µM, 2 s) mixed with co-agonist glycine (30 µM) recorded in magnesium-free solution from TG neurons at the holding potential −40 mV; (B) Percentage of responding cells induced by NMDA from all recorded neurons (110 cells); (C) Distribution of peak amplitudes of NMDA evoked currents in TG neurons.

