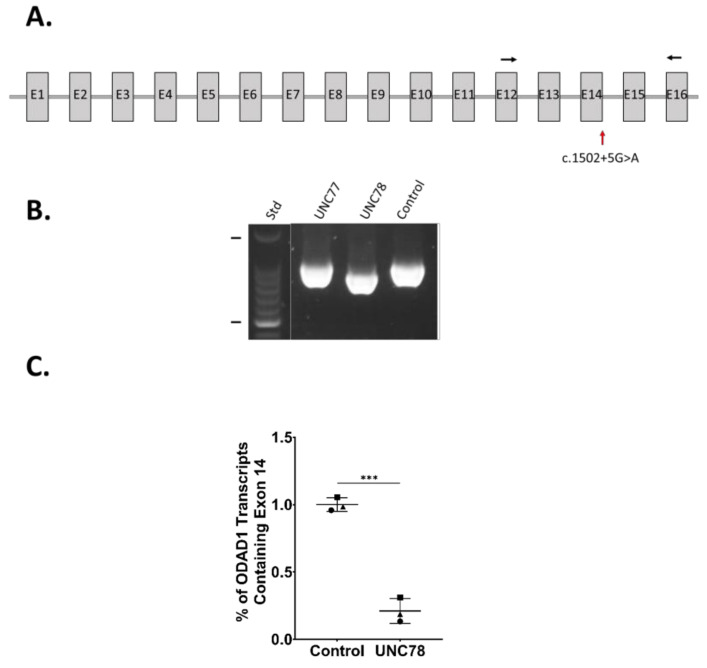
Figure 3.
(A) Schematic of the ODAD1 transcript (NM_001364171.2) showing the relative locations of the c.1502+5G>A variant (red arrow) and the primers used for RT-PCR (black arrows). (B) The major product produced by RT-PCR of UNC78 was shorter than that produced from UNC77 and an unrelated control, due to the skipping of exon 14. (C) ddPCR demonstrated the expression of a greatly reduced level of ODAD1 transcripts containing exon 14 in samples from UNC78. Symbols, datapoints from individual experiments; lines, the mean and std. dev.; ***, p < 0.001 by a two-tailed t-test. (n = 3 experiments).

