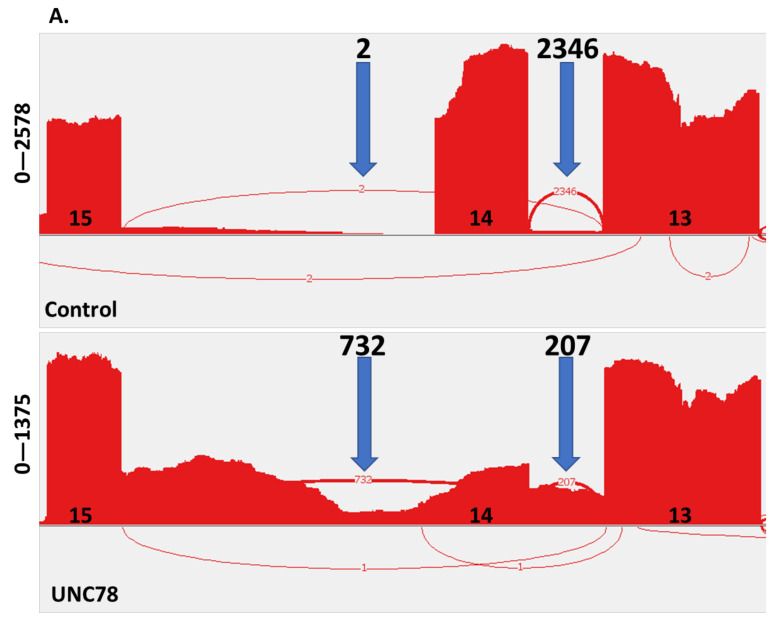
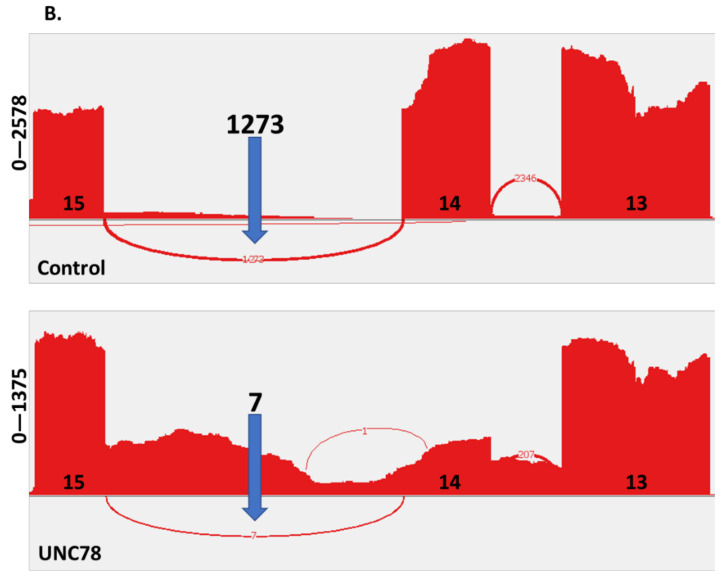
Figure 4.
Analysis of ODAD1 transcripts. RNA-seq was performed on RNA isolated from differentiated cultures of control HNE cells and UNC78. (A) Sashimi plot showing splicing from exon 13 in control (top) and UNC78 (bottom) samples. (B) Sashimi plot showing splicing from exon 14. Location of exons (13, 14, 15) is shown along the x-axis; y-axis indicates number of reads. Blue arrows, number of spliced transcripts between the indicated exons. The sample from UNC78 has little evidence of correct splicing. See text for details.


