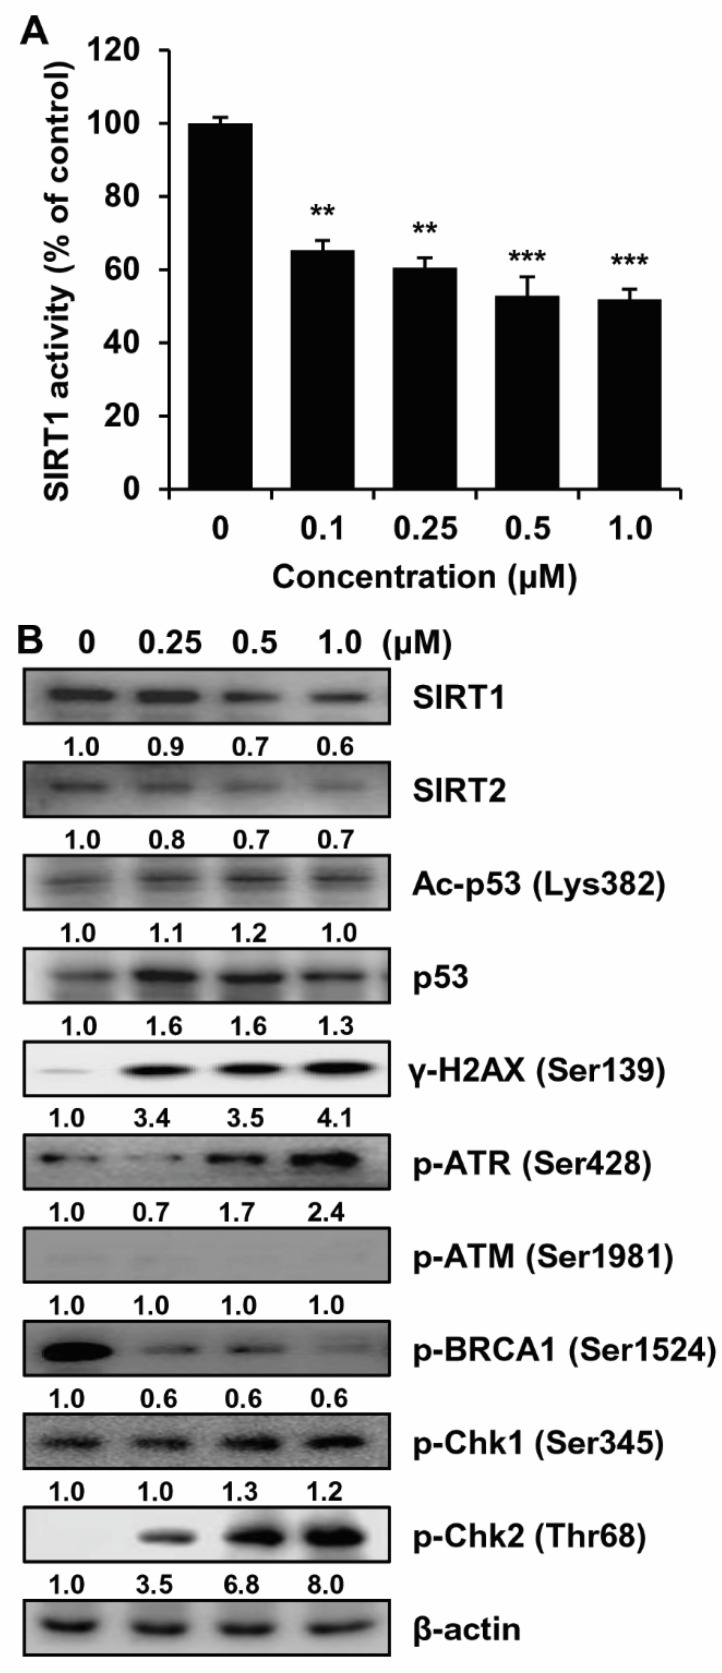
Figure 4.
Effect of MHY2245 on SIRT and the expression of DNA damage response mediators and effector cascade in HCT116 cells. (A) Graph showing SIRT1 activity. Results are presented as mean ± SD, n = 3, and are expressed as a percentage of SIRT1 activity in vehicle-treated control cells. ** p < 0.01 and *** p < 0.001 compared with vehicle-treated control cells. (B) Cells were treated with the indicated concentrations of MHY2245 for 24 h and Western blot analyses were conducted to investigate the expression of SIRT1, SIRT2, Ac-p53 (Lys382), p53, γ-H2AX (Ser139), p-ATR (Ser428), p-ATM (Ser1981), p-BRCA1 (Ser1524), p-Chk1 (Ser345), and p-Chk2 (Thr68). β-actin was used as a loading control. Representative results from three independent experiments are shown.

