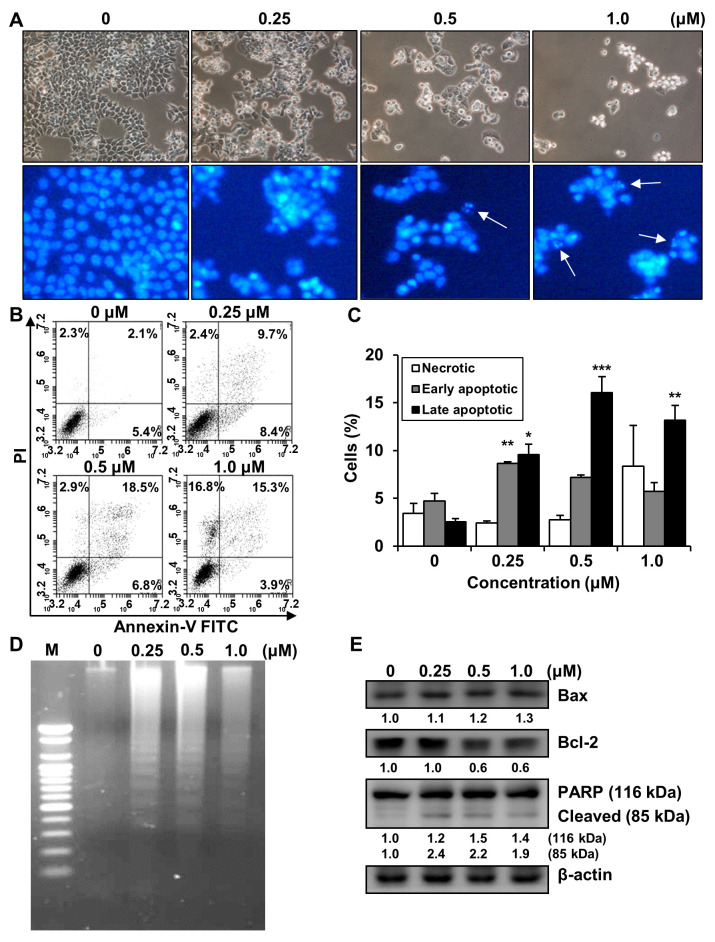
Figure 6.
Effect of MHY2245 on the induction of apoptosis in HCT116 cells. (A) Morphological changes in MHY2245-treated cells. HCT116 cell nuclei were stained with fluorescent DNA-binding dye (Hoechst 33342). Arrows indicate apoptotic cells (×100). (B) Effect of MHY2245 on the death of cells stained with Annexin V-FITC/PI and analyzed via flow cytometry. (C) Graph showing the effect of MHY2245 on cell death. Results are presented as mean ± SD, n = 3, and are expressed as a percentage of that in vehicle-treated control cells. * p < 0.05, ** p < 0.01, and *** p < 0.001 compared with vehicle-treated control cells. (D) Representative results of DNA analyses from three independent experiments are provided. M, marker. (E) Effects of MHY2245 on the expression of Bax, Bcl-2, and PARP in HCT116 cells. Western blot analysis of total lysates of cells treated with increasing concentrations of MHY2245. β-actin was used as a loading control. Representative results from three independent experiments are shown.

