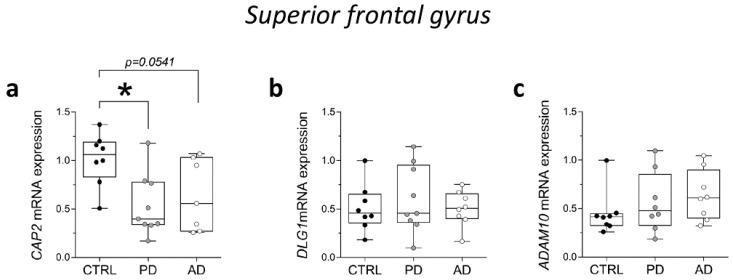
Figure 7.
Analysis of transcript of CAP2, DLG1, and ADAM10 in the post-mortem superior frontal gyrus of Alzheimer’s and Parkinson’s disease patients. mRNA expression levels of (a) CAP2 (CTRL, n = 8, PD, n = 9, AD, n = 7), (b) DLG1 (CTRL, n = 8, PD, n = 9, AD, n = 8), and (c) ADAM10 (CTRL/PD/AD, n = 8) in the post-mortem superior frontal gyrus. CAP2, DLG1, and ADAM10 transcript levels were detected by quantitative RT-PCR, normalized to the mean of two housekeeping genes (ACTB and PPIA), and expressed as 2−ΔΔCt. Each dot represents values from a single subject. * p < 0.05 compared to the control group (Mann–Whitney test).

