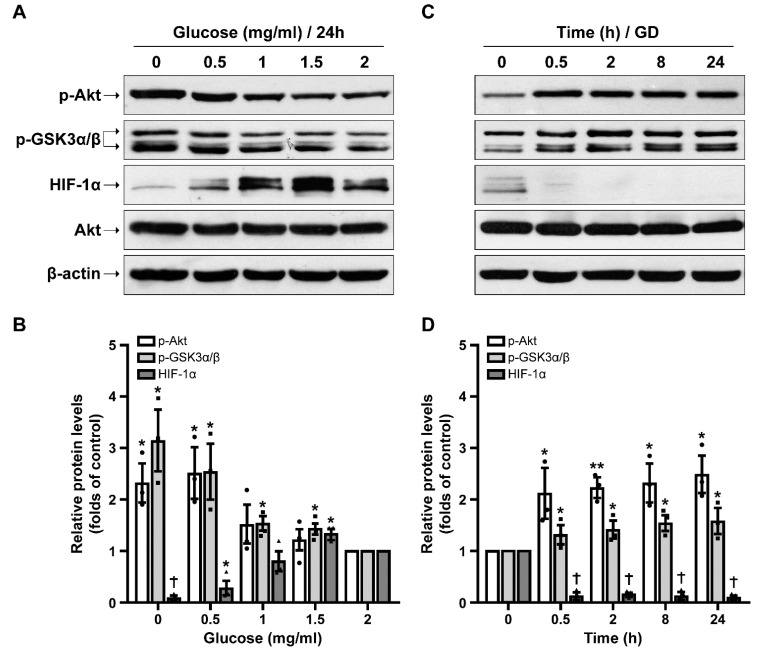
Figure 1.
Opposite effects of glucose deprivation on p-Akt, p-GSK3α/β and HIF-1α protein levels. (A) Representative Western blot images of SH-SY5Y cells treated with increasing glucose concentrations (0–2 mg/mL in RPMI containing 10% FBS) for 24 h. (B) Quantification of p-Akt, p-GSK3α/β and HIF-1α protein levels for dose-dependent effect. Data are presented as mean ± S.E.M., n = 3, * p < 0.05, † p < 0.001, compared to control (2 mg/mL). (C) Representative Western blot images of cells incubated for 0.5–24 h in the absence of glucose (GD, glucose deprivation) in RPMI containing 10% FBS. (D) Quantification of p-Akt, p-GSK3α/β and HIF-1α protein levels for time-dependent effect. Data are presented as mean ± S.E.M., n = 3, * p < 0.05, ** p < 0.01, † p < 0.001, compared to control (0 h).

