Figure 6.
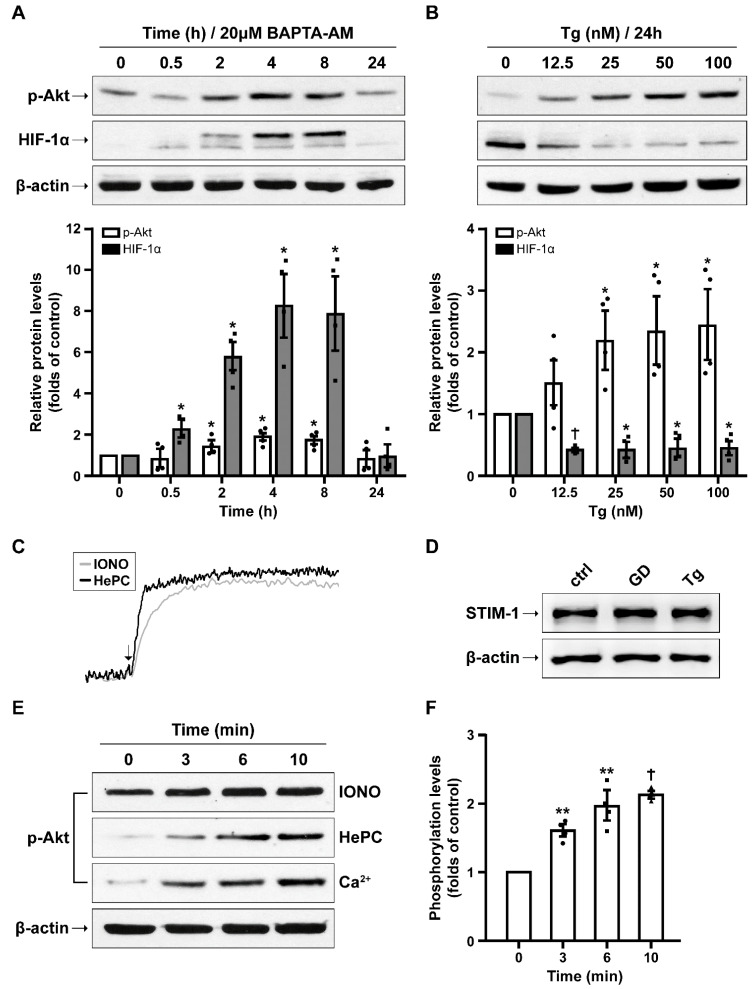
Ca2+ entry activates Akt. (A) Representative Western blot images and quantification of p-Akt and HIF-1α levels in SH-SY5Y cells incubated with 20 μΜ BAPTA-AM, a Ca2+ chelating agent, for 0.5 up to 24 h. (B) Representative Western blot images and quantification of p-Akt, and HIF-1α levels in SH-SY5Y cells treated with thapsigargin (Tg, 0–100 nM) for 24 h. (C) Ca2+ entry induced by ionomycin (IONO) or miltefosine (HePC) measured in Fura-2 loaded SH-SY5Y cells in Ca2+ containing KRH (representative traces from 3–6 independent experiments). (D) Representative Western blot image of STIM1 levels during glucose deprivation (GD) or Tg (100 nM) treatment for 24 h. (E,F) Representative Western blot images and quantification of p-Akt levels in SH-SY5Y cells detached and re-suspended in KRH buffer supplemented with IONO (500 nM) or HePC (20 μM). In the case of CaCl2 (3 mM), cells were pre-treated with Tg in Ca2+ free-KRH for 10 min. Cells were harvested after 0, 3, 6, and 10 min of incubation. All data are presented as mean ± S.E.M., n = 4, * p < 0.05, ** p < 0.01, † p < 0.001, compared to controls.

