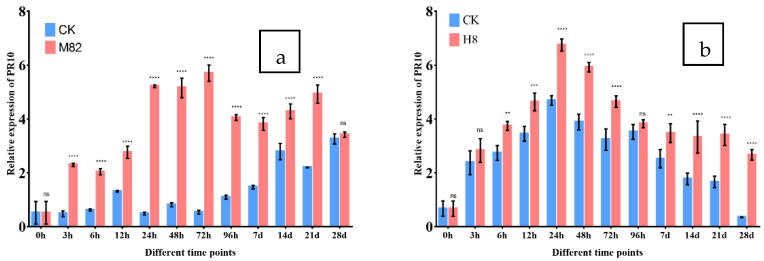
Figure 10.
PR-10 expression in M82 and H8 plants. The relative transcription levels of TSWV-infected tomato M82 and H8 plants were normalized to the control gene Actin, as measured by qRT-PCR of PR-10 protein. At 0, 3, 6, 12, 24, 48, 72, and 96 h pi (hours post infection) and 7, 14, 21 and 28 dpi (days post infection), the expression levels in the leaf tissues were assessed (days post infection). The CK plants are shown by blue bars, while the M82 and H8 plants are represented by red bars. Three biological replicates’ mean results (±SD) are shown as relative changes. (a) PR-10 relative expression in M82 plants vs. CK (not inoculated with TSWV) and (b) PR-10 relative expression in H8 plants compared to CK. Asterisk indicates statistically significant; ** p = 0.01, *** p = 0.001, **** p = 0.0001, and ns = non-significant are the p values.

