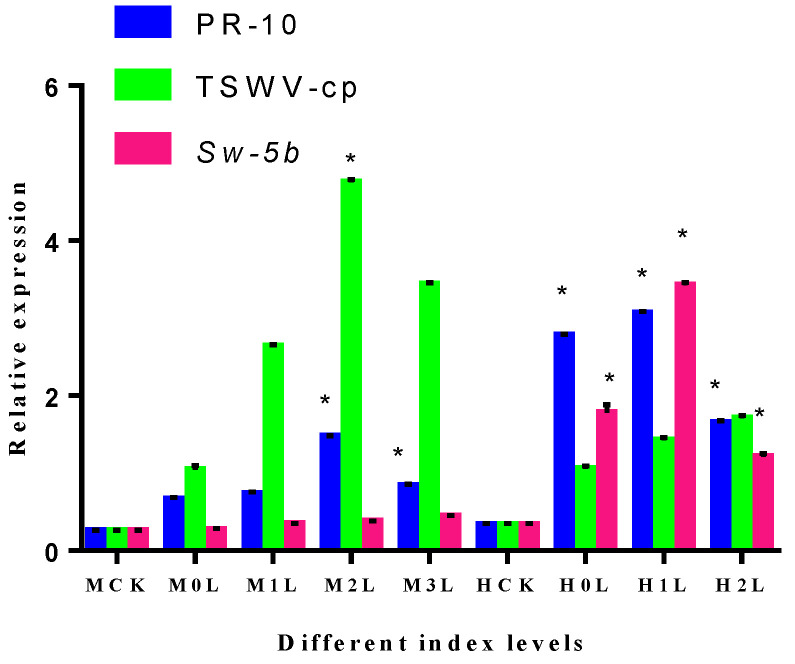
Figure 14.
Expression of different index levels of plant roots in M82 and H8. Relative transcription levels determined by qRT-PCR of PR-10 protein, TSWV-cp protein, and Sw-5b; tomato M82 and H8 plants were infected with TSWV inoculum and the relative transcription levels were normalized to the control gene Actin. The expression levels in the root tissues were measured at different disease index levels. Blue bars represent the PR-10 proteins, light green bars represent the TSWV-cp protein, and purple bars represent Sw-5b. The mean values (±SD) from three biological replicates are presented as relative changes. The least significant difference (LSD) test was used to determine if a gene showed significant induction as compared to the transcript abundance of the control group (MCK represents the M82 CK plant; M represents the M82-treated plant; HCK represents the H8, CK plant; and H represents the H8-treated plant). Asterisk indicates statistically significant; * p = 0.05 and ns = non-significant are the p values.

