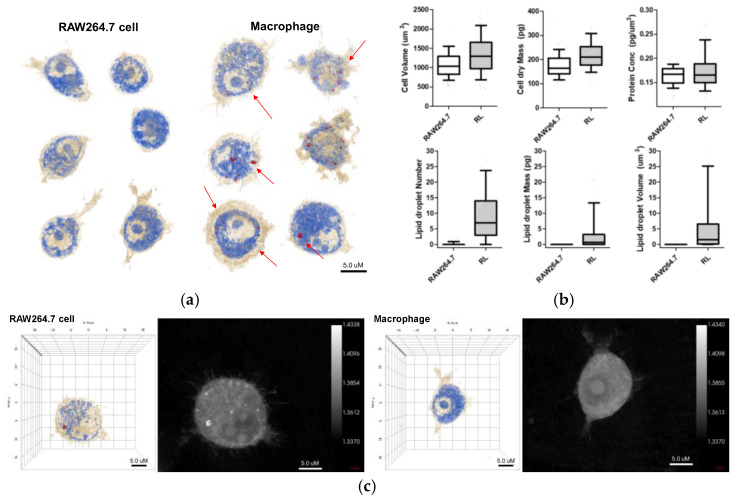
Figure 2.
(a) 3D holotomographic images of LPS-induced macrophages show significant changes compared to RAW264.7 cell line. Cell size and morphological changes appeared after 48 h of incubation with LPS. (b) The characteristics of RAW264.7 cells and macrophages were quantitatively compared through numerical analysis. This analysis results exhibit the morphological and biological changes using RAW264.7 cell (n = 320) and macrophage (RL; n = 262). Data are presented as a box-and-whiskers plot, with 10–90 percentile of results. Additionally, all of the data show significant differences (p < 0.001). (c) 3D RI tomograms (left) of each cell were reconstructed from multiple 2D hologram images (right).

