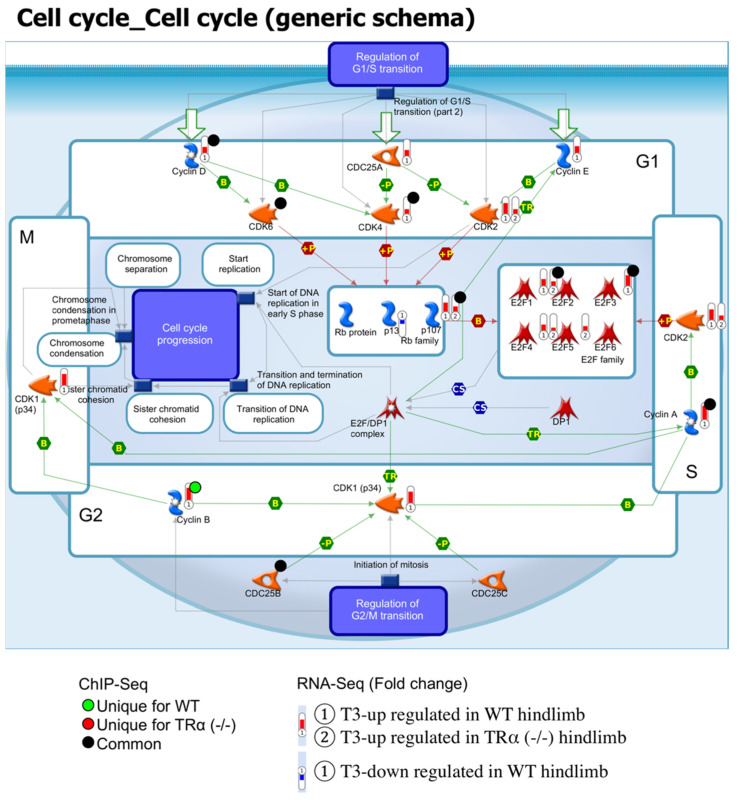
Figure 7.
TR-binding and regulation of genes in the cell cycle pathway in hind limb based on ChIP-seq and RNA-seq data. The pathway for the generic schema of the cell cycle was visualized with regard to genes regulated by T3, based on RNA-seq, or bound by TR based on ChIP-seq. The arrows show functional interaction: green for activation. The red histograms labeled ① and ② show the genes upregulated by T3 in the hind limb of wild-type and TRα (-/-) tadpoles, respectively. The blue histogram labeled ① show the genes that were downregulated by T3 in wild type tadpoles. Green circles indicate genes bound by TR uniquely in wild type hind limb without or with T3 treatment. Red circles indicate genes bound by TR uniquely in TRα (-/-) hind limb without or with T3 treatment. The black circle indicates genes bound by TR in both wild type and TRα (-/-) hind limb. Note that most of the genes in the cell cycle pathway that were upregulated by T3 and bound by TR in wild type hind limb were not regulated by T3 in TRα (-/-) hind limb, suggesting that TRα plays an important role in mediating T3 regulation of this pathway during hind limb metamorphosis.

