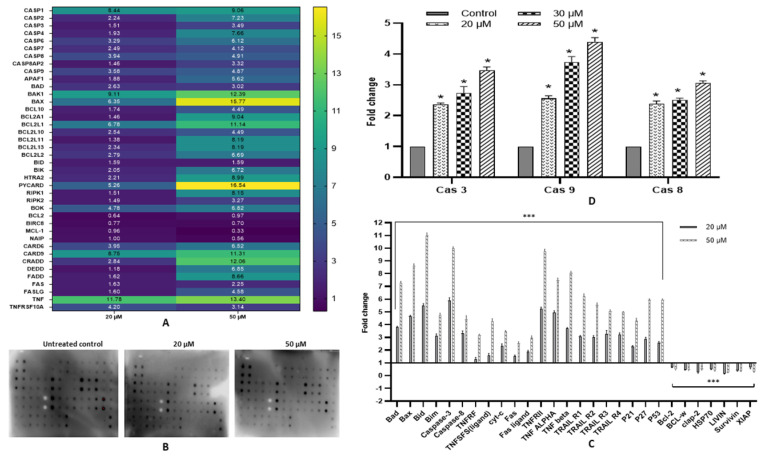
Figure 4.
Expression analysis. (A). Heat map showing the expression of various genes involved in apoptosis. RQ plot of caspases, extrinsic receptors and ligands, pro-apoptotic gene and anti-apoptotic after fisetin treatment at 20 μM and 50 μM for 48 h. (B) Images of nitrocellulose proteome profiler showing differential expression of the regulatory pathway and apoptotic proteins in the control and fisetin-treated sample (20 and 50 μM of fisetin for 48 h). (C) Graphical representation of protein expression as fold change compared with the control sample. Fisetin treatment increased pro-apoptotic while decreasing the expression of anti-apoptotic proteins [* p ≤ 0.05, *** p < 0.001]. (D) Evaluation of caspase 3, caspase 8 and caspase 9 activity of fisetin-treated HeLa cells at 20, 30 and 50 μM for 48 h. Graph represents an increase in the fold change in caspase 3, 8 and 9 activity compared with the control.

