Figure 2.
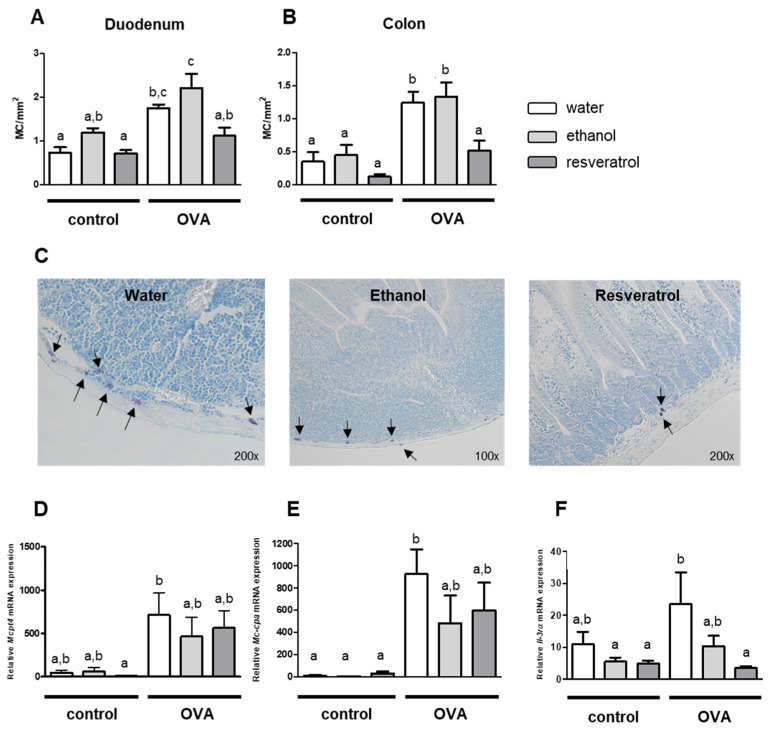
Mast cell (MC) numbers per mm2 in duodenum (A) and colon (B) tissue and representative pictures of MC in duodenum of OVA-treated mice (C). mRNA expression of Mcpt4 (D) (n = 8), Mc-cpa (E) (n = 5) and Il-3rα (F) (n = 6–8) in colon. Mice received water (white), 50 mg/kg BW ethanol (light grey) or 50 mg/kg BW resveratrol (dark grey) via drinking water for 28 days and were i.p. sensitized with 50 µg OVA in alum (1:2) on day 5 and 11 and further treated with or without (control) 50 mg OVA orally on day 15, 18, 20, 22, 24 and 27. Numbers of MC were determined in toluidine blue stained duodenum and colon sections, respectively and are indicated by black arrows (C), group size was n = 8, respectively. Values are mean ± SEM. Common letters indicate no significant difference between groups, different letters indicate significant change with at least p < 0.05. p-values for the respective data sets are given in Figure S2.

