


Figure 2. Receiver-Operating-Characteristic (ROC) Curves of Frozen section for STAS detection.
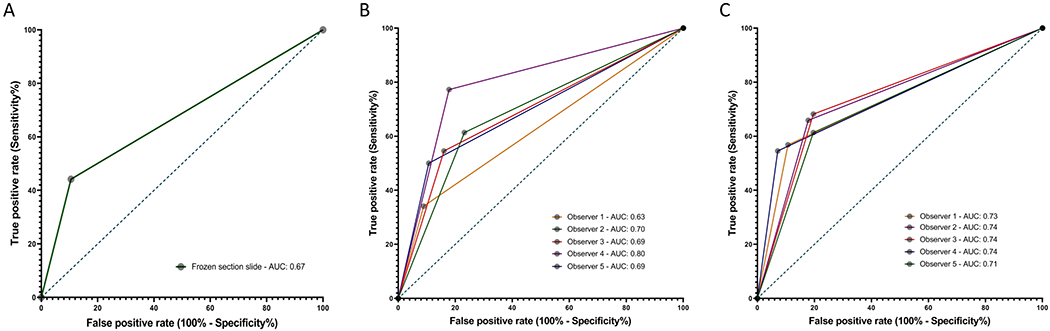
Diagnostic performance was determined by comparing the final integrated diagnosis based on review of all histology slides by the panel of there pathologists with: (A) the diagnoses obtained in Frozen section slides by the panel; (B) the individual diagnoses obtained by each of the 5 observers in Frozen section slides in the first round, and (C) those in the second round of evaluation.