
Figure 3. Variability in diagnosis of STAS across observers in Frozen section.
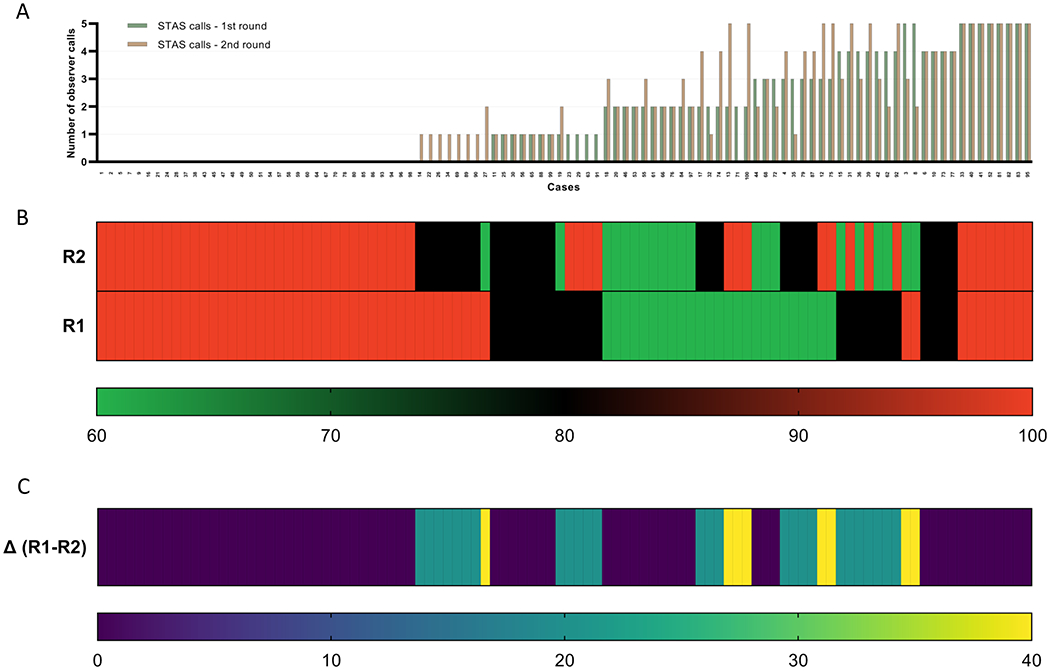
(A) The number of observers identifying STAS for each case is presented for round 1 (R1), and round 2 (R2). The green bar represents the STAS calls in the round 1; the orange bars represent the STAS calls in the round 2. (B) Inter-observer concordance rate for each case is presented in the heat map for both rounds. Each column represents an individual case. The bottom row represents R1; the top row R2. The scale bar below (thin rectangle) indicates the level of inter-observer concordance. Red denotes full inter-observer concordance (100%); green, poor inter-observer concordance (60%) among the five observers. (C) Differences in inter-observer concordance rates between both rounds of evaluation (∆R1-R2) are presented in the heat map. Each column represents an individual case. The scale bar below (thin rectangle) indicates the degree of difference in inter-observer concordance between both rounds of evaluation. Yellow denotes a higher difference in concordance between rounds (∆R1-R2: 40%); blue, no difference (∆R1-R2: 0%). Cases are displayed in panels B and C to match the same sequence in which they are displayed in panel A.