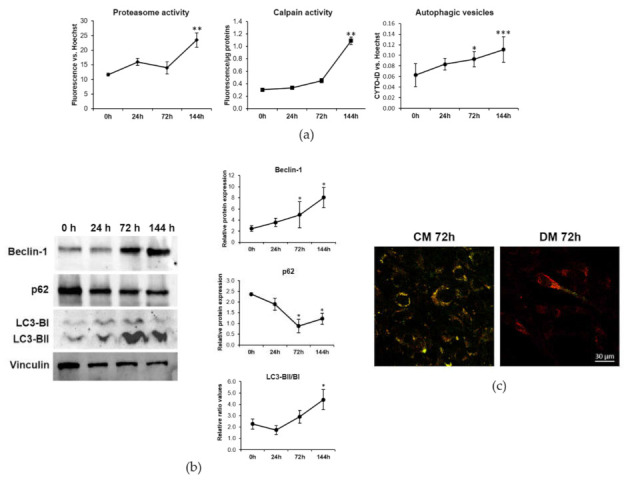
Figure 3.

Calpains, proteasome and autophagy are activated during myogenesis. C2C12 were induced to differentiate in DM. (a) Proteasome and Calpain activity and autophagic vesicles were measured as described in the methods. (b) The amounts of Beclin-1, p62 and LC3-BII/LC3-BI were analyzed by western blot. Vinculin was used as control of loading. A representative blot (left panel) and densitometry performed on three independent experiments and obtained by ImageLab (right panel) are shown. (c) Autophagic flux imaging was performed by the Tandem fluorescent-tagged LC3 assay as described in the methods. Non-parametric Mann–Whitney test was performed to define statistical significance among the time points. * Indicates significance compared to 0 h. * p ≤ 0.05; ** p ≤ 0.01; *** p ≤ 0.001.
