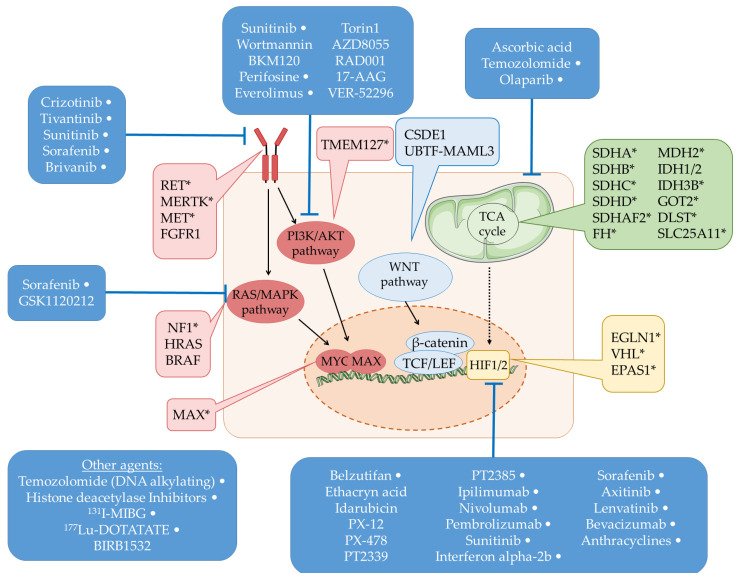
Figure 1.
Schematic representation of the main pathways associated with PPGL tumorigenesis. The genes marked with ‘*’ are germline susceptible PPGL genes as well. The therapeutic agents targeting the associated genes or pathways are also displayed. The therapeutic agents marked with ‘White dot’ represent the specific agents which are involved in clinical trials or approved in the clinical setting, whereas the unmarked agents are being studied in in vitro or in vivo models currently.

