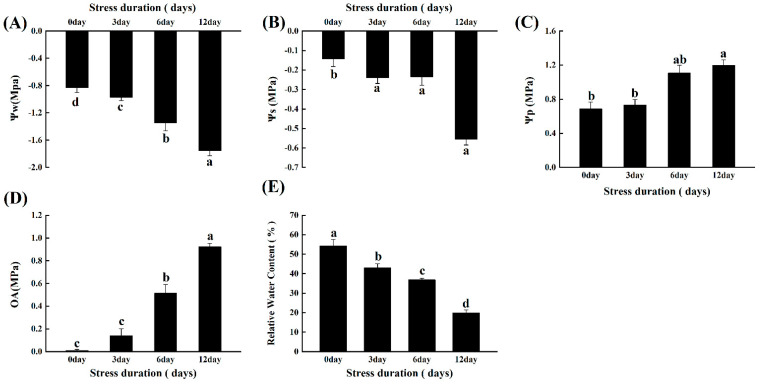
Figure 2.
Effects of salt stress on (A) water potential (Ψw); (B) osmotic potential (Ψs); (C) turgor potential (Ψp); (D) osmotic adjustments (OA) and (E) relative water content (RWC) in leaves of tomato seedlings grown for 12 days under control and salt stress. Values are mean ± SD (Standard Deviation) of three replications. Different letters indicate significant differences at p ≤ 0.05 (Tukey’s HSD test).

