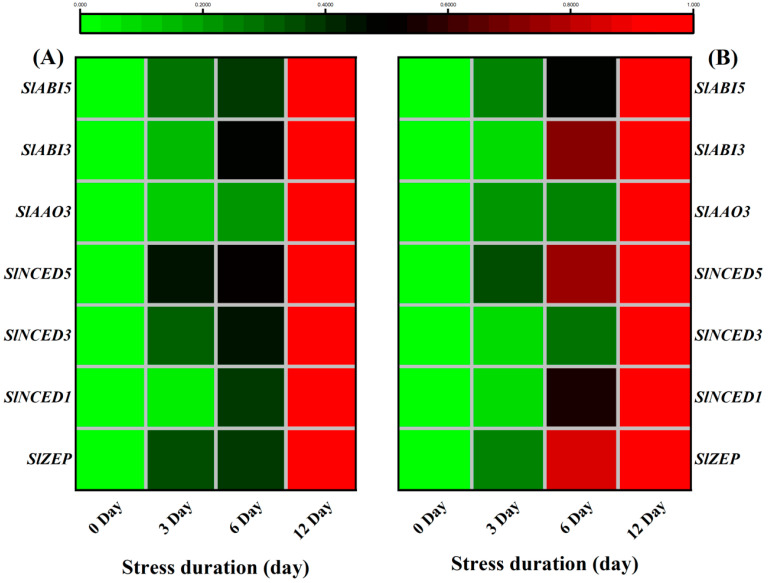
Figure 11.
Heatmap of selected genes related to ABA biosynthesis pathway quantified from tomato (A) Leaves; (B) roots after 12 days of salt treatment. The scale (Log2 of the mean values after normalization; n = 3) shows the increase in relative concentrations from green to red color, compared to control (0 h).

