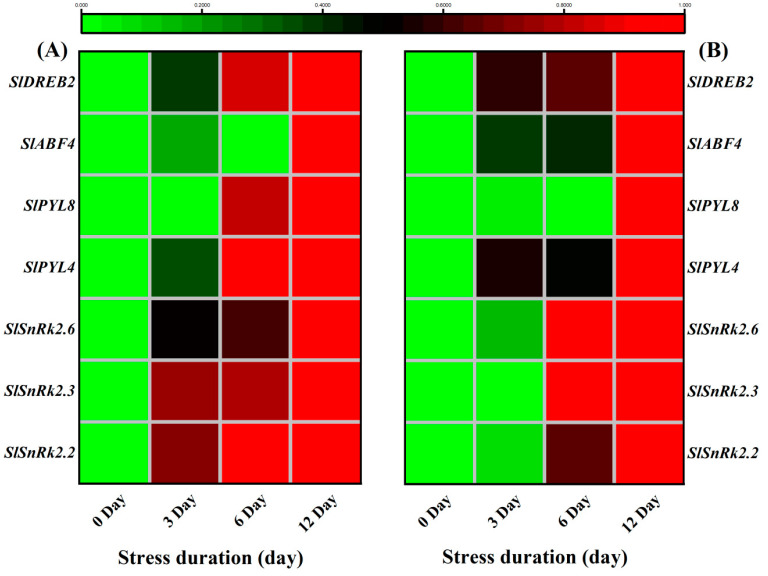
Figure 12.
Heatmap of selected genes related to ABA signalling pathway. The relative expression level was quantified from tomato (A) Leaves and (B) roots after 12 days of salt treatment. The scale (Log2 of the mean values after normalization; n = 3) shows the increase in relative concentrations from green to red color, compared to control (0 h).

