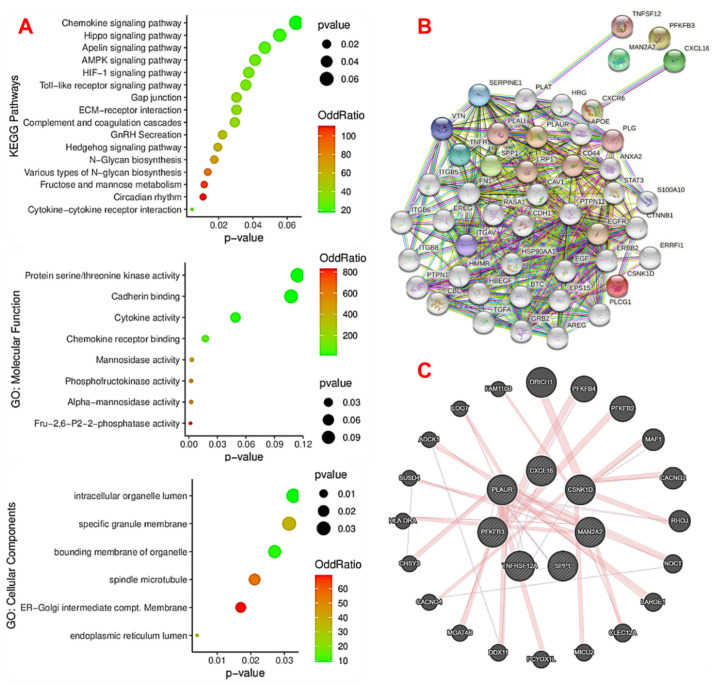
Figure 4.
Functional enrichment analysis and biological network analysis of the MTSCPPC signature. (A) Visualization of enriched terms in KEGG pathways, and molecular function and cellular component categories in the GO analysis. The color intensity and the size of the round circles indicate, respectively, the odds ratios and p-values of enrichment. All terms were only considered to be significantly enriched at p < 0.05. Visualization of the significant (B) protein–protein interaction (PPI) and (C) gene–gene interaction (GGI) network clusters of the DEGs.

