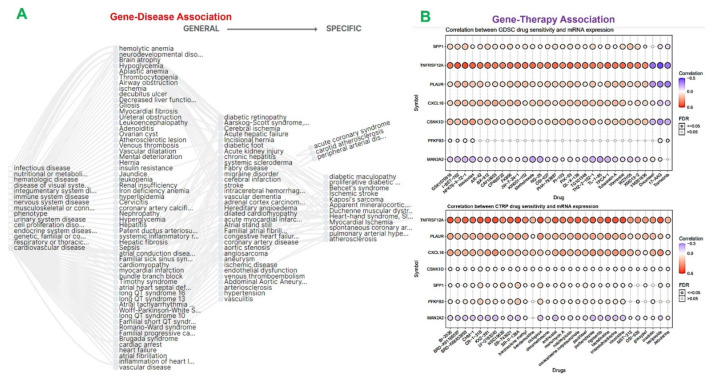
Figure 5.
Gene–disease and drug sensitivity associated with the MTSCPPC signature. (A) Gene–disease network plot of MAN2A2, TNFRSF12A, SPP1, CSNK1D, PLAUR, PFKFB3, and CXCL16. (B) Bubble plot of correlations between gene mRNA expression levels and small-molecule sensitivity. Colors from blue to red represent the correlation between the 50% inhibitory concentration (IC50) value of small molecules and mRNA expression levels of the MTSCPPC signature.

