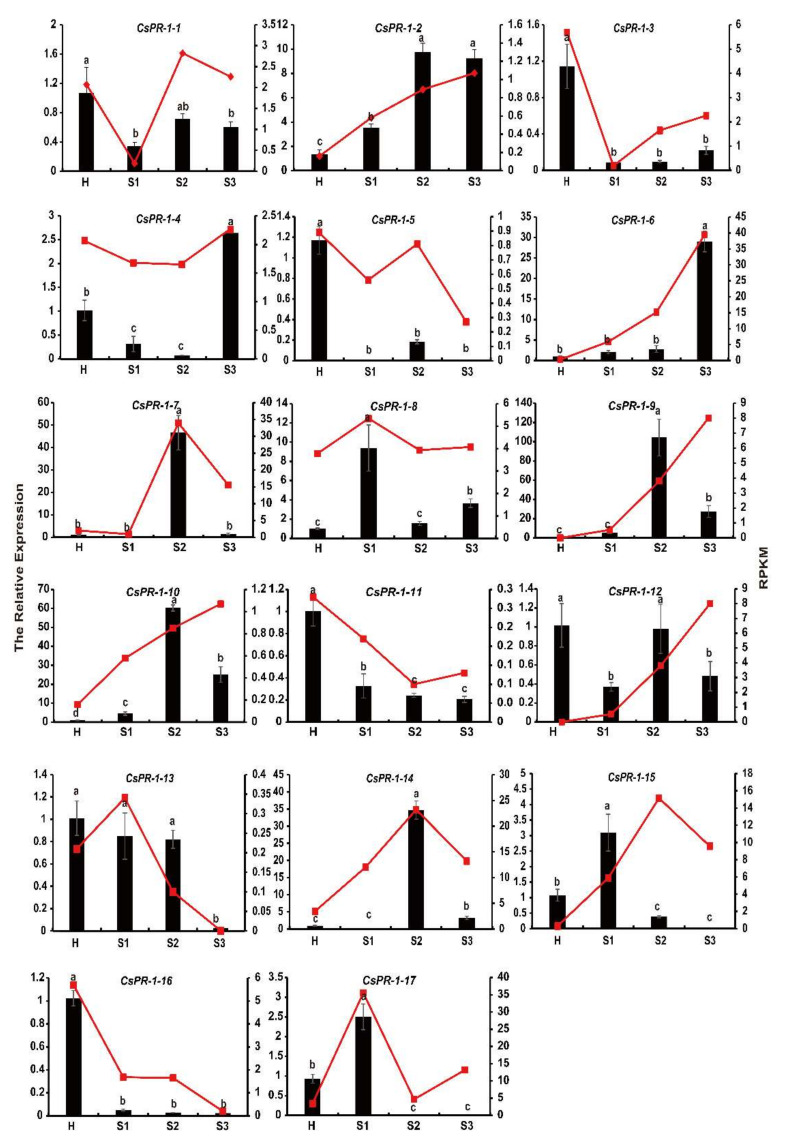
Figure 7.
Comparison of the transcript expression results from the RNA-seq and qRT-PCR analysis of the CsPR-1 family genes under tea blister-blight disease stress. The relative expression of genes validated using qRT-PCR (bar chart, left ordinate) and the fragments per kilobase of transcript per million mapped reads obtained from transcriptome sequencing (line diagram, right ordinate).

