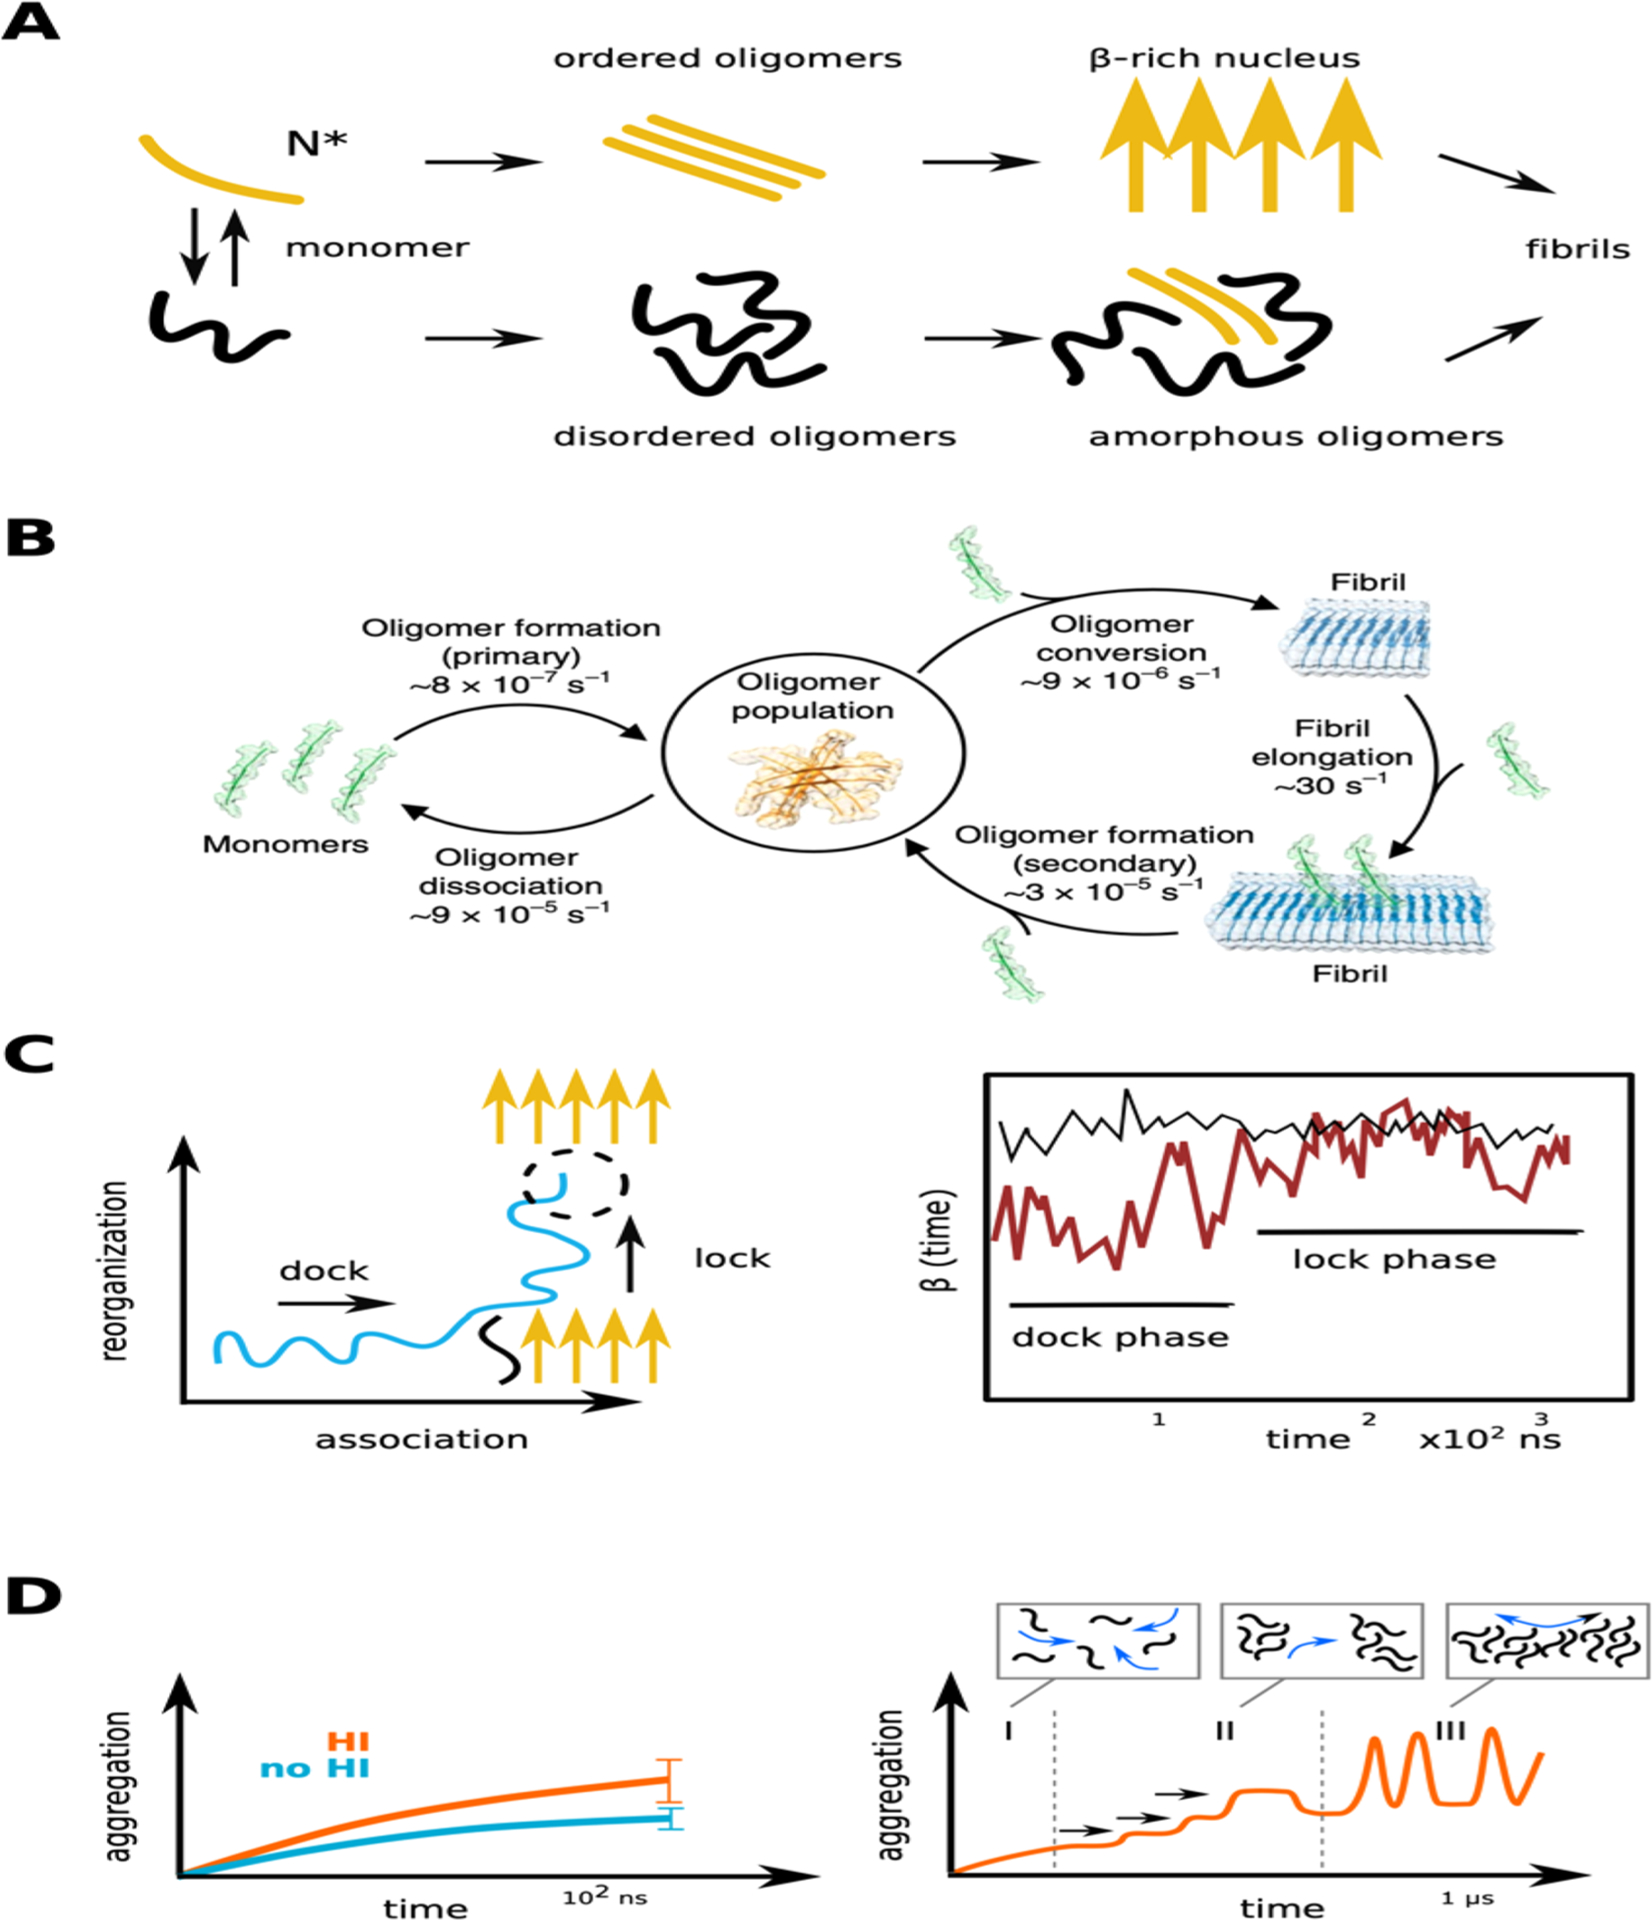
Figure 11.

(A) Schematic representation of two extreme scenarios, the one-step and the two-steps nucleation process for early steps of amyloid aggregation.366 (B) Characteristic steps and kinetics of Aβ42 amyloid proliferation determined experimentally, with the reaction rates at a concentration of 5 microM.370 (C) Description of the dock and lock mechanism, left chart schematically reproduces the results,375 where the evolution of the β-structure of a monomer is followed in time during the dock and lock phases. (D) Effect of hydrodynamic interactions on the aggregation process of Aβ16–22 peptides (left) and protofibril elongation due to oligomer fusion (right) as observed in LBMD simulations.366,394
