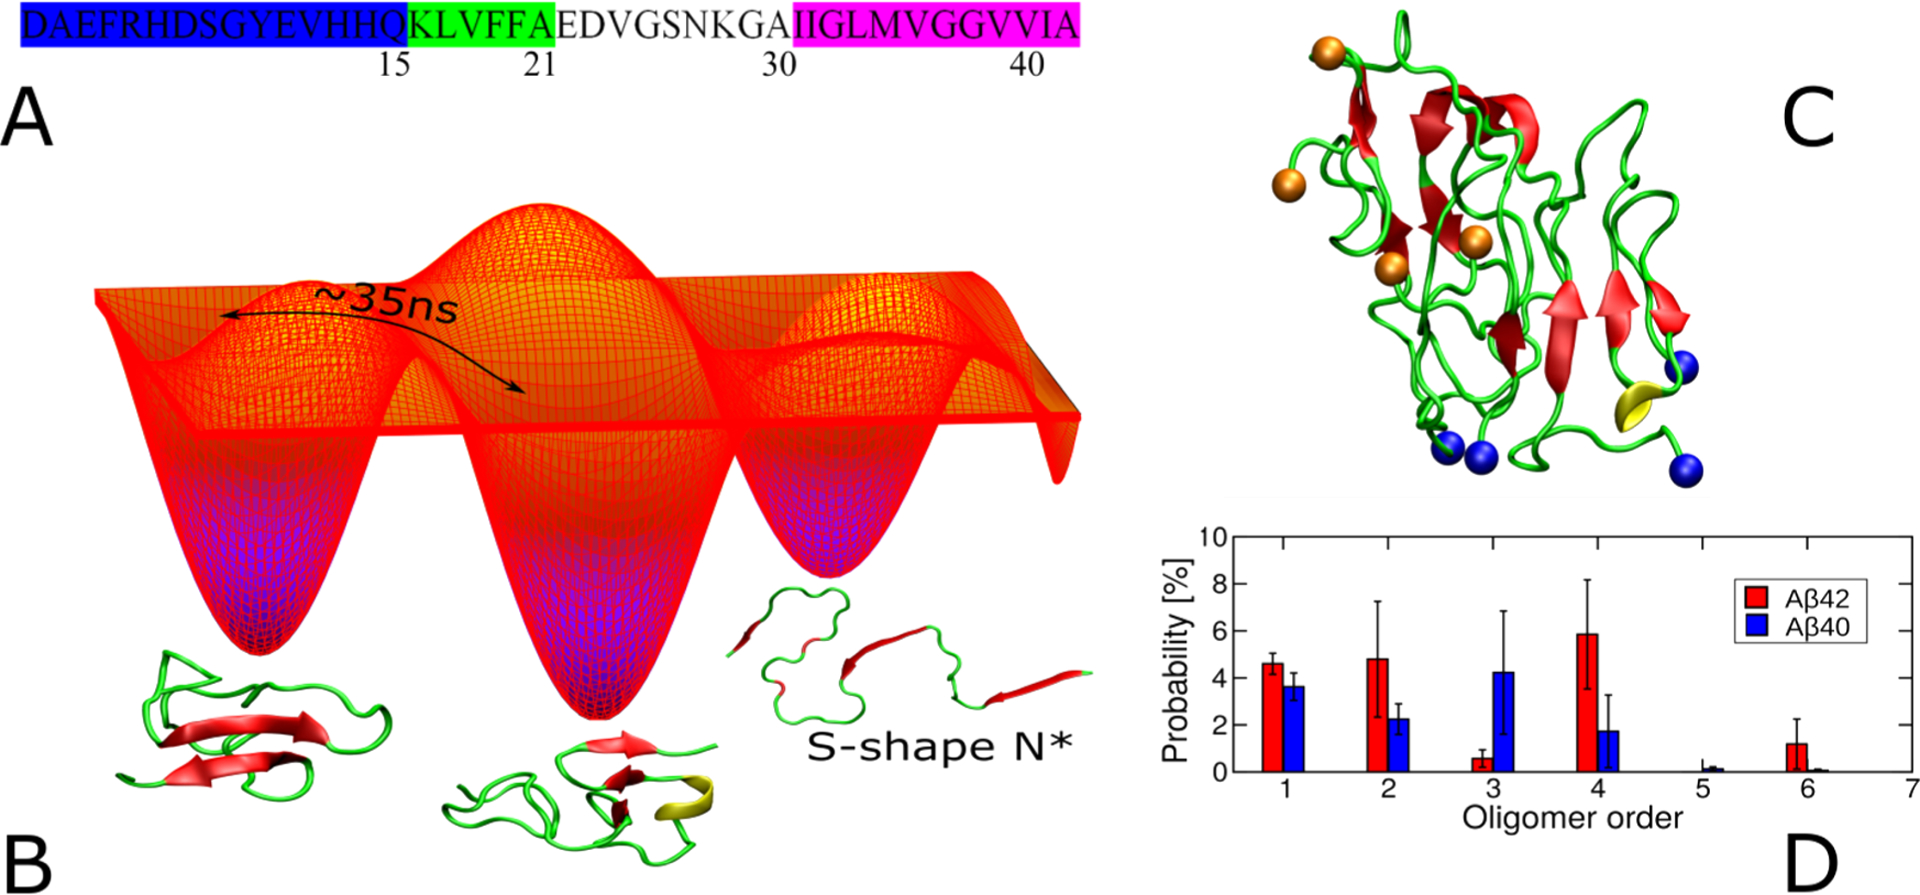
Figure 13.

(A) N-terminus (blue, 1–15), CHC (green, 16–21), loop (gray, 22–29), and C-terminus (purple, 30–40/42). (B) Schematic free energy landscape of Aβ monomers. Switching between some conformations occurs within 35 ns, as reported by FRET data.428 The conformation of S-shape N* from the fibril structure with PDB ID 2NAO was also sampled in CG simulations.437 (C) Representative structure of the Aβ42 tetramer, obtained by using multiscale MD simulation.451 Blue and orange balls refer to the first and last residues, respectively, of monomer subunits. (D) Population of oligomer sizes obtained from simulations of 20-peptides.463
