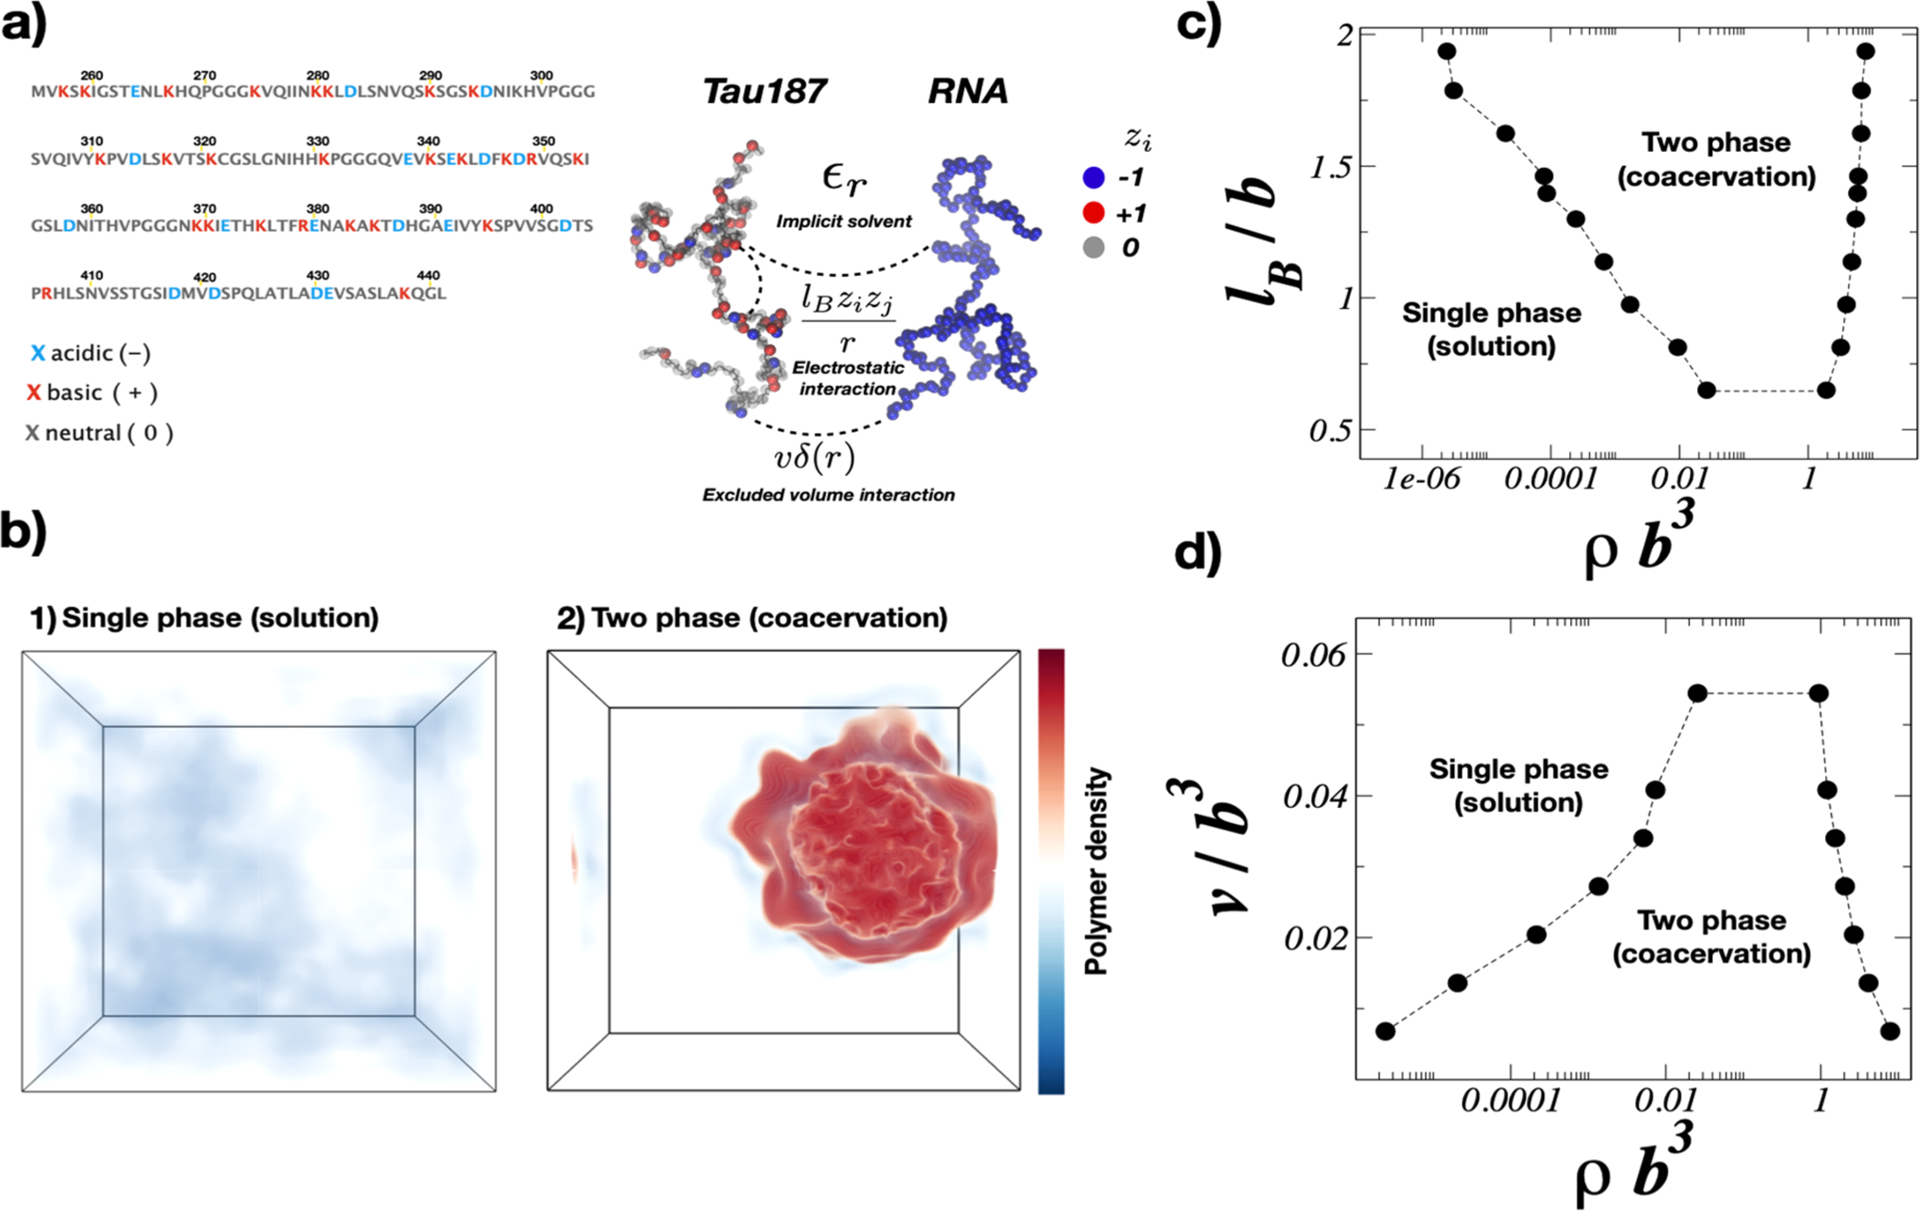
Figure 17.

(a) Schematic representation of Tau and RNA models. Tau and RNA are modeled as chains of bonded monomeric units with size b in implicit solvent. The charge of each monomer is determined from the corresponding amino acid in the tau sequence at pH = 7. RNA is modeled as a uniformly charged polyanion. (b) Tau solution phases at fixed total density: (b-1) single phase solution in weak electrostatic strength and good solvent conditions (lB = 0.16 b, v = 0.02 b3); (b-2) two phase coacervate in relatively strong electrostatic interaction and low solvent quality (lB = 3.25 b, v = 0.0068 b3). (c) Coexistence phase boundary determined from FTS as a function of the Bjerrum length and tau density at fixed excluded volume of v = 0.0068 b3. (d) Binodal points as a function of the excluded volume at fixed Bjerrum length lB = 1.79 b.570
