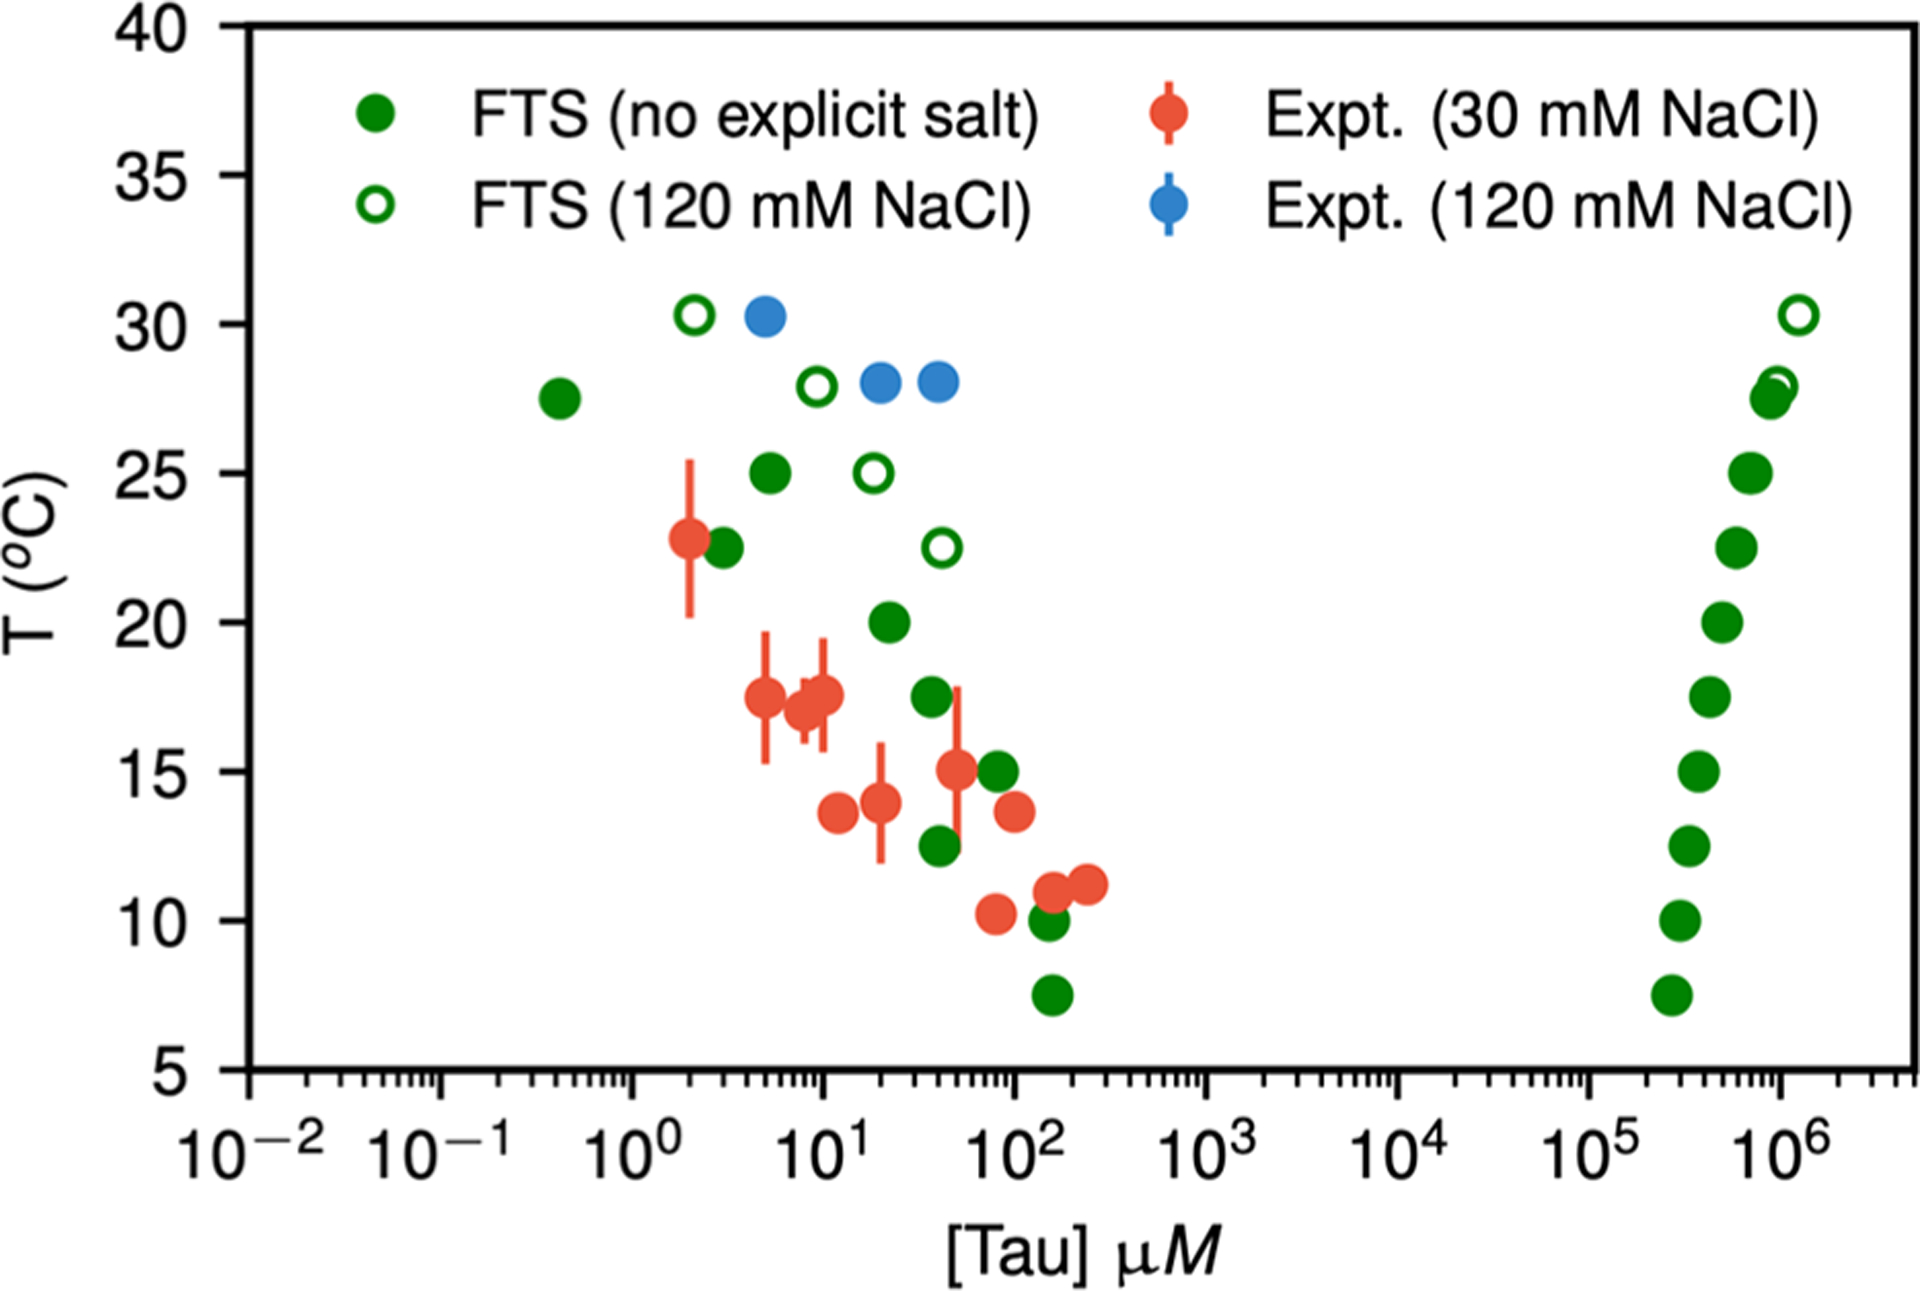
Figure 18.

Coexistence points obtained from parametrized FTS at low salt (filled green circles) and at 120 mM NaCl (open green circles) as compared to experimental cloud point temperature as measured in turbidity experiments performed at 20 mM NaCl (filled red circles) and 120 mM (filled blue circles). The experimentally determined cloud point temperature corresponds to the low-density branch of the phase diagram. FTS simulations also predict the corresponding high-density branch of the binodal curve.570
