
Figure 2.
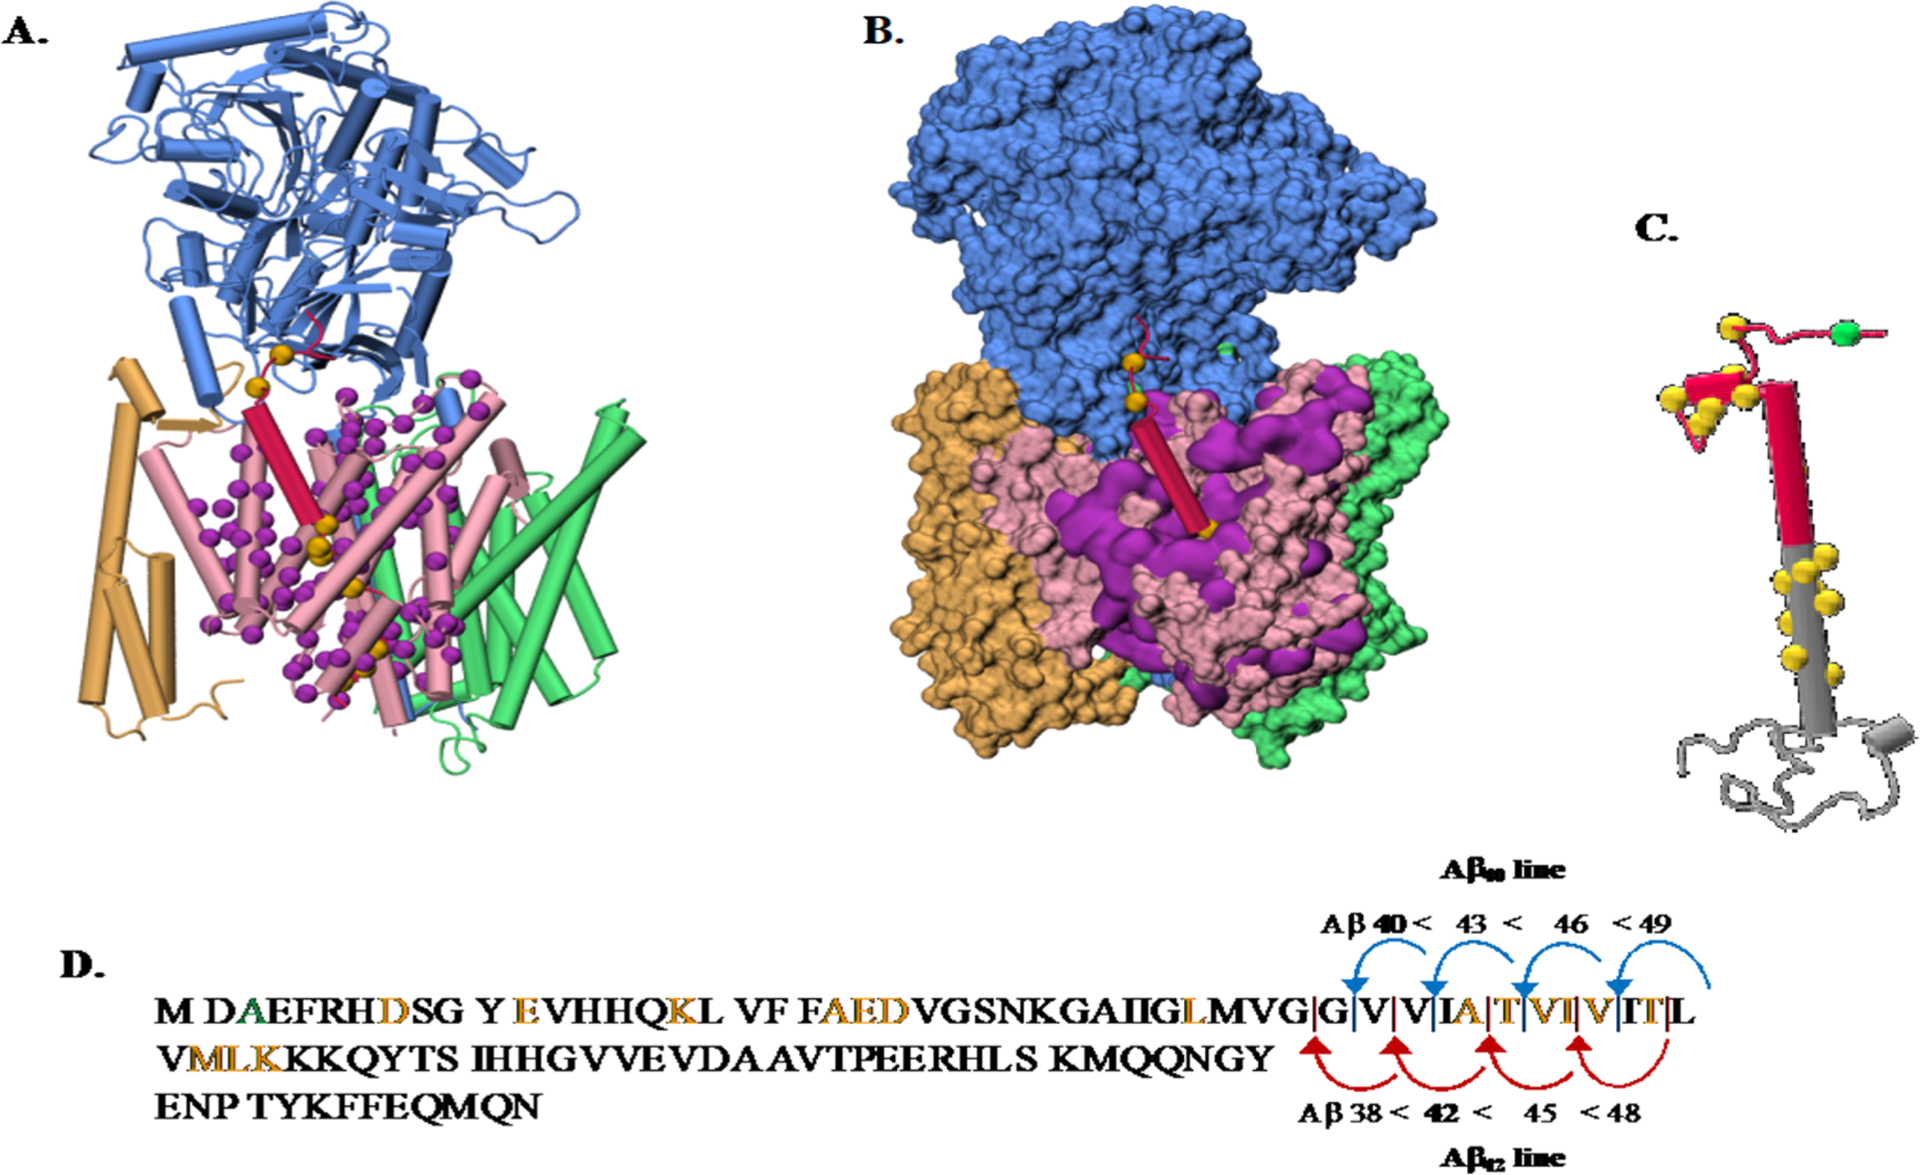
(A) Overview of the gS and APP structures and pathogenic AD mutations. (A) Depiction of the gS complex (PDB 6IYC).95 NCT subunit (blue), APH-1A (green), PEN-2 (yellow), and the catalytic PSN subunit (pink) bound to a C99 fragment (red). C-alpha atoms from the PSN disease-causing mutations139 that affect C99 processing are shown (purple spheres). C99 disease causing mutations available in the 6IYC structure are shown (yellow spheres). (B) gS structure with the same color code as part A in a surface representation. (C) Depiction of a C99 structure model (gray) with the Aβ sequence highlighted (red). C-alpha atoms from disease causing mutations are shown in yellow spheres with the protective Icelandic mutant (green). (D) C99 sequence with mutations highlighted in the same color code representation and showing the two main Aβ production lines. The structures in parts A, B, and C from the PDB were drawn using VMD.140