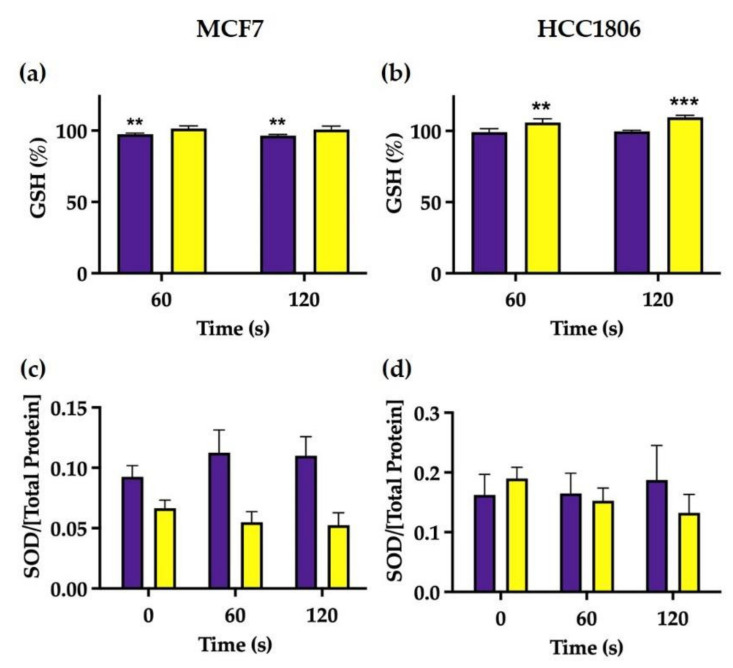
Figure 4.
Intracellular GSH expression (a,b) and SOD activity (c,d) in MCF7 (a,c) and HCC1806 (b,d) cells were measured 2 and 24 h after treatment. GSH results are presented normalized to the value 100% corresponding to control cell cultures not exposed to cold atmospheric plasma (CAP). Data represent the mean ± SE of at least two independent experiments on both cell lines. Statistically significant differences are shown with ** p < 0.01 and *** p < 0.001.

