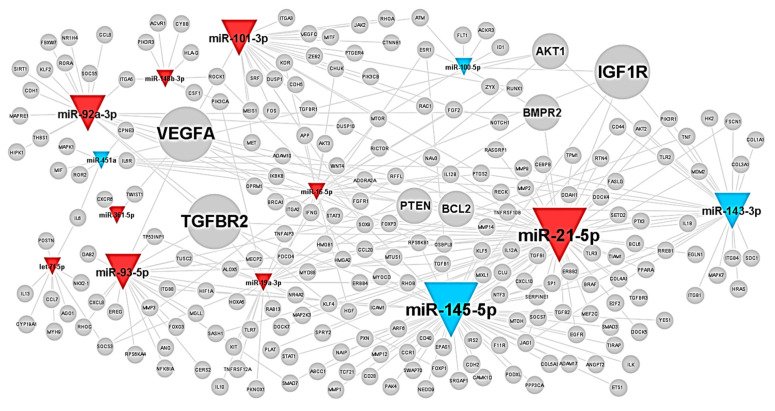
Figure A5.
The typical miRNAs–target network in shear stress-induced EC-sEVs was visualized by WEB-based Gene SeT AnaLysis Toolkit (WebGestalt). The colors of triangles indicate upregulated (red) or downregulated (blue) miRNAs in OSS-sEVs compared to LSS-sEVs. The size of the gray nodes representing target proteins indicates the number of miRNAs regulating the target protein.

