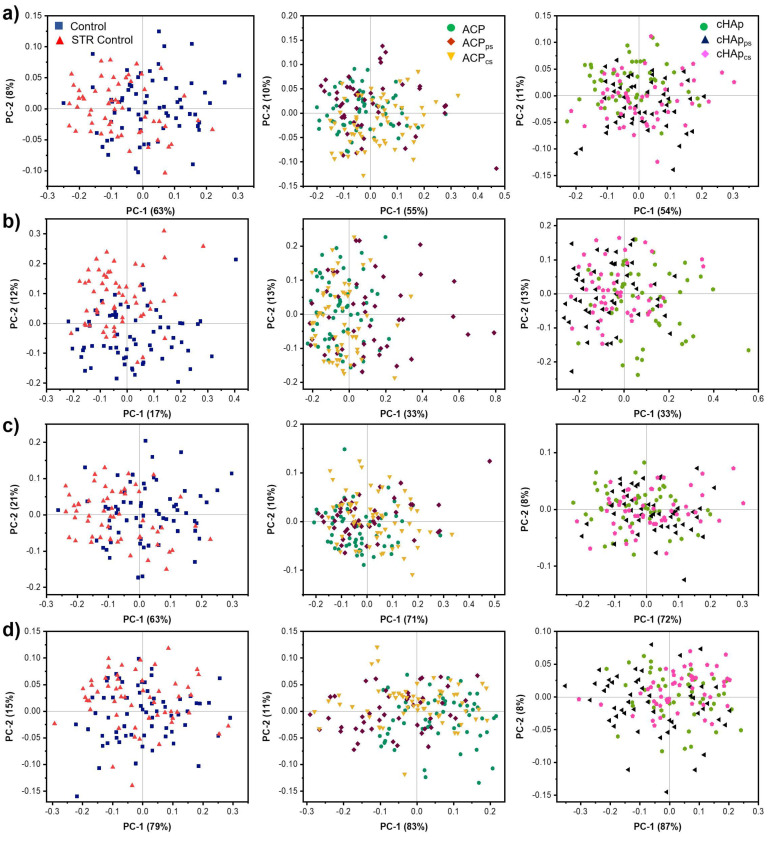
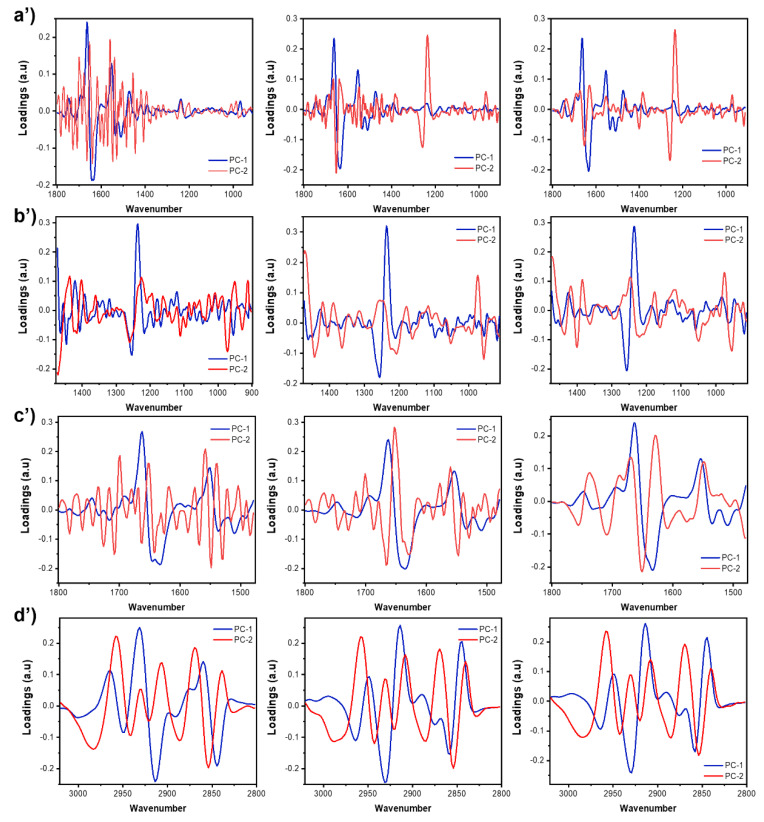
Figure 9.
Principal component analysis (PCA) score plots (a–d) and loading plots (a’–d’) from 2nd derivative spectra of groups of treated Saos-2 cells. Biochemical changes from each biochemical group were discriminated considering the PC1 versus PC2 score plot: (a,a’) fingerprint, (b,b’) DNA and glucids, (c,c’) proteins and (d,d’) lipids.


