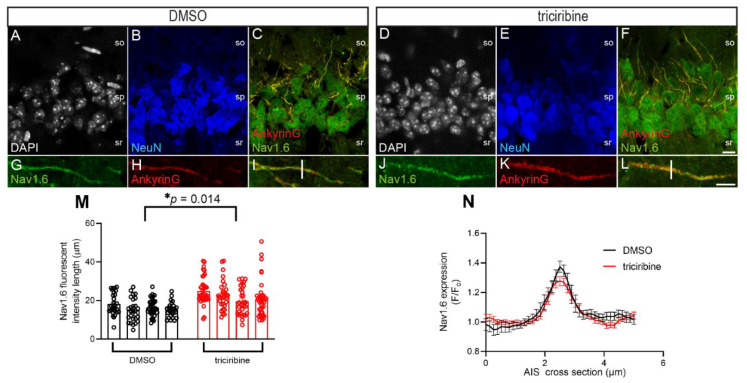
Figure 4.
Treatment with triciribine alters length of the Nav1.6 immunofluorescence at the AIS but not fluorescent intensity of Nav1.6. Representative images of the CA1 region of (A–C) DMSO and (D–F) triciribine treated slices, with (A,D) DAPI (gray), (B,E) NeuN (blue), and (C,F) AnkyrinG (red) and Nav1.6 (green) merging. Scale bar in (F) is 10 µm. Zoom to AIS in (G–I) DMSO and (J–L) triciribine-treated slices with (G,J) Nav1.6 (green), (H,K) AnkyrinG (red), and (I,L) merging in both channels, and the white bar indicates an analyzed 5 µm cross-section. Scale bar in (L) indicates 5 µm. Stratum oriens (so), stratum pyramidale (sp), and stratum radiatum (sr) are indicated. (M) Treatment with 20 µM triciribine for 2 h significantly increased the length of the Nav1.6+ fluorescent intensity at the AIS, but (N) does not alter the fluorescent intensity of Nav1.6 as measured by the cross-section of the AIS. Data shown are mean ± SEM and separated scatter graph with bars to illustrate biological replicates (n = 4 brain slices per condition) in panel (M). * p = 0.0104 as analyzed by a two-tailed nested t-test. Data were log normalized before analysis. Zeiss 63× oil immersion objective (1.4 NA) was used in all cases.

