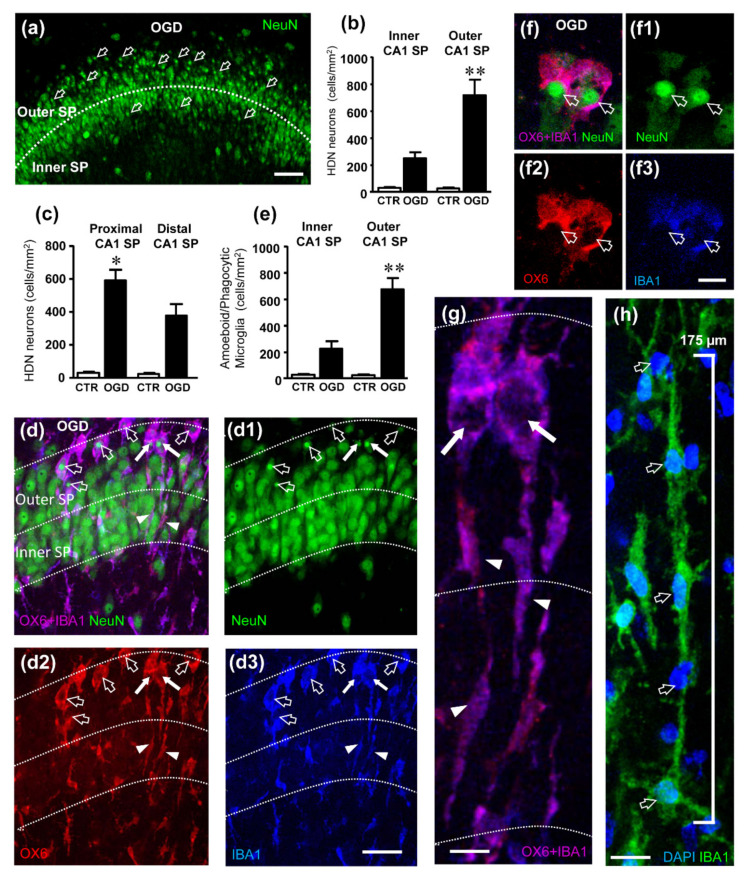
Figure 3.
(a) Representative confocal images of NeuN-positive neurons (green) in CA1 of an OGD organotypic hippocampal slice. The image was obtained from a single confocal scan captured with a 20× objective, total thickness 1.2 µm. The dotted line delineates the inner and outer CA1 SP layers. Numerous HDN neurons (open arrows) are located mainly in the outer layer of CA1 SP. Scale bar: 50 µm. (b) Quantitative analyses of HDN neurons density (cells/mm2) in the inner and outer CA1 SP. Statistical analysis: ** p < 0.01, Outer CA1 SP OGD vs. Inner CA1 SP OGD. (c) Quantitative analyses of HDN neurons density (cells/mm2) in the proximal and distal CA1 SP. Statistical analysis: * p < 0.05, Distal CA1 SP OGD vs. Proximal CA1 SP OGD. (d–d3) Representative confocal images of NeuN-positive neurons (green, (d1)), OX6-positive active microglia (red, (d2)) and IBA1-positive total microglia (blue, (d3)) in CA1 of an OGD organotypic hippocampal slice captured with a 63× objective. The merge of the three immunofluorescent staining is shown in (d) in which the pink-purple color is indicative of active (OX6-positive) microglia cells (IBA1-positive). The images were obtained stacking 10 consecutive confocal scans (z step 0.3 µm, total thickness 3 µm). Numerous active microglia cell bodies phagocytosing HDN neurons are present in the outer CA1 SP (open arrows). The dotted lines delineate the inner and outer CA1 SP. Scale bar: 25 µm. (e) Quantitative analyses of the density of phagocytic microglia (cells/mm2) in the inner and outer layers of CA1 SP. Statistical analysis: ** p < 0.01, Outer CA1 SP OGD vs. Inner CA1 SP OGD. In the bar graphs, each bar represents the mean ± SEM of 7–9 independent slices. All statistical analyses were performed by Student’s paired t test. (f–f3) Representative confocal images of NeuN-positive neurons (green, (f1)), OX6-positive active microglia (red, (f2)) and IBA1-positive total microglia (blue, (f3)) in CA1 of an OGD organotypic hippocampal slice captured with a 63× objective. The merge of the three immunofluorescent staining is shown in (f). The images were obtained stacking 10 consecutive confocal scans (z step 0.3 µm, total thickness 3 µm) taken in the outer CA1 SP and show two active (OX6-positive, (f2)) microglia cells phagocytosing HDN neurons. Scale bar: 10 µm. (g) Enlargement of the IBA1-positive (blue) and OX6-positive (red) microglia cells indicated by the white arrows in (d). The images were obtained stacking 10 consecutive confocal scans (z step 0.3 µm, total thickness 3 µm) and show rod microglia with a rod “tail” (arrowheads) and a phagocytic “head” (arrows). The neurons were eliminated for clarity. Scale bar: 7.5 µm. (h) Representative confocal images of IBA1-positive microglia (green) and DAPI-positive nuclei (open arrows, blue) in CA1 of an OGD organotypic hippocampal slice captured with a 63× objective. The image was obtained by stacking 10 consecutive confocal scans (z step 0.3 µm, total thickness 3 µm). It is clearly visible that 5 rod microglia cells form a train. Scale bar: 15 µm.

