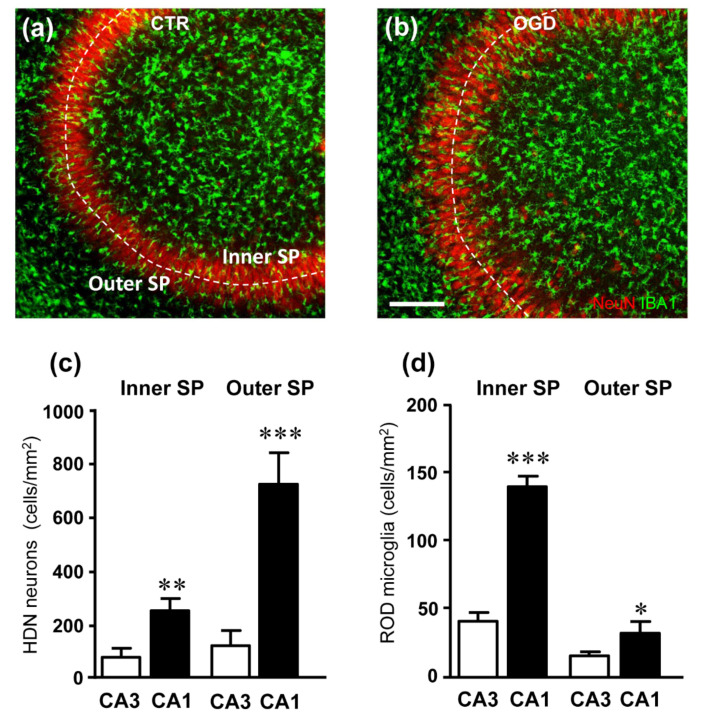
Figure 5.
(a,b) Representative confocal images of NeuN-positive neurons (red) and IBA1-positive total microglia (green) in CA3 hippocampus of a CTR (a) and an OGD (b) organotypic hippocampal slices captured with a 20× objective. Images were obtained stacking 3 consecutive confocal scans (z step 1.2 µm, total thickness 3.6 µm). It appears that HDN neurons and rod microglia were not significantly more numerous in the OGD slice than in the control slice. The dotted lines delineate the inner and outer CA3 SP layers. Scale bar: 125 µm. (c) Quantitative analysis of HDN neurons density (cells/mm2) in the inner and outer layers of CA3 and CA1 SP of slices subjected to OGD. HDN neurons were significantly more numerous in both the inner and outer CA1 SP than in the inner and outer CA3 SP, respectively. Statistical analysis: ** p < 0.01, inner CA1 SP vs. inner CA3 SP; *** p < 0.001, outer CA1 SP vs. outer CA3 SP. (d) Quantitative analysis of rod microglia density (cells/mm2) in the inner and outer layers of CA3 and CA1 SP of slices subjected to OGD. Rod microglia were significantly more numerous in both the inner and outer CA1 SP than in the inner and outer CA3 SP, respectively. Statistical analysis: *** p < 0.001, inner CA1 SP vs. inner CA3 SP; * p < 0.05, outer CA1 SP vs. outer CA3 SP. In the bar graphs, each bar represents the mean ± SEM of 7–11 independent slices. All statistical analyses were performed by Student’s paired t test.

