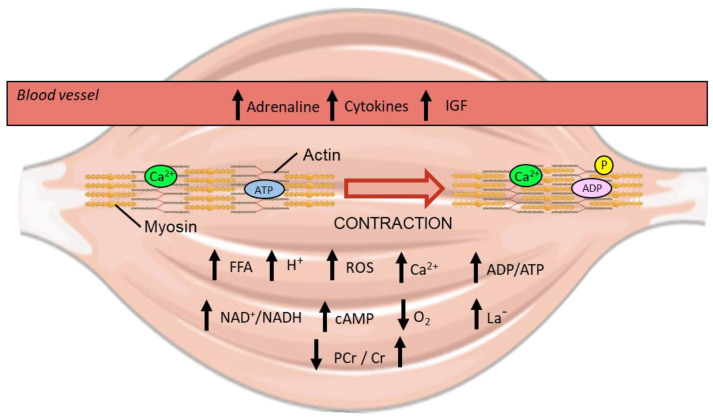
Figure 6.
Visualisation of the homeostatic perturbations that occur during exercise within human skeletal muscle [65]. Up and down arrows indicate an increase or decrease in metabolite concentration respectively from exercise. IGF; insulin-like growth factor. ROS; reactive oxygen species. FFA; free fatty acid. PCr; phosphocreatine. Cr; creatine. Ca2+; calcium ion. P; phosphate. ADP; adenosine diphosphate. ATP; adenosine triphosphate. H+; hydrogen ion. NAD+; nicotinamide adenine dinucleotide. cAMP; cyclic adenosine monophosphate. La-; lactate.

