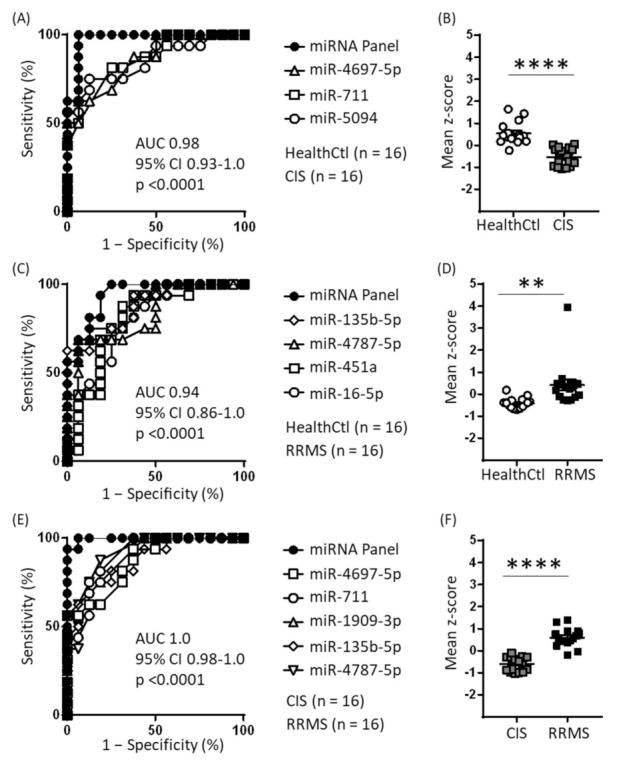
Figure 3.

Receiver operating characteristic (ROC) analysis of CIS-specific and RRMS-specific EV miRNAs. (A) Using z-score transformation of normalized counts, 5 of the 6 CIS-specific down-regulated miRNAs were found to have significant predictive power for CIS–HealthCtl separation, and the mean of the three most predictive miRNAs yielded a profile with even greater predictive power. (B) Individual subject means of the z scores for the three miRNAs given in (A). **** p < 0.0001, unpaired two-tailed Student’s t test. (C) Using z-score transformation of normalized counts, 8 of the 9 RRMS-specific up-regulated miRNAs were found to have significant predictive power for RRMS–HealthCtl separation, and the mean of the four most predictive miRNAs yielded a profile with even greater predictive power. (D) Individual subject means of the z scores for the four miRNAs given in C. ** p = 0.003, unpaired two-tailed Student’s t test. (E) Using z-score transformation of normalized counts, all 6 CIS-specific down-regulated miRNAs and 7 of 9 RRMS-specific up-regulated miRNAs were found to have significant predictive power for CIS–RRMS separation, and the mean of the three most predictive CIS-specific and three most predictive RRMS-specific miRNAs yielded a profile with even greater predictive power. (F) Individual subject means of the z scores for the six miRNAs given in E. **** p < 0.0001, unpaired two-tailed Student’s t test.
