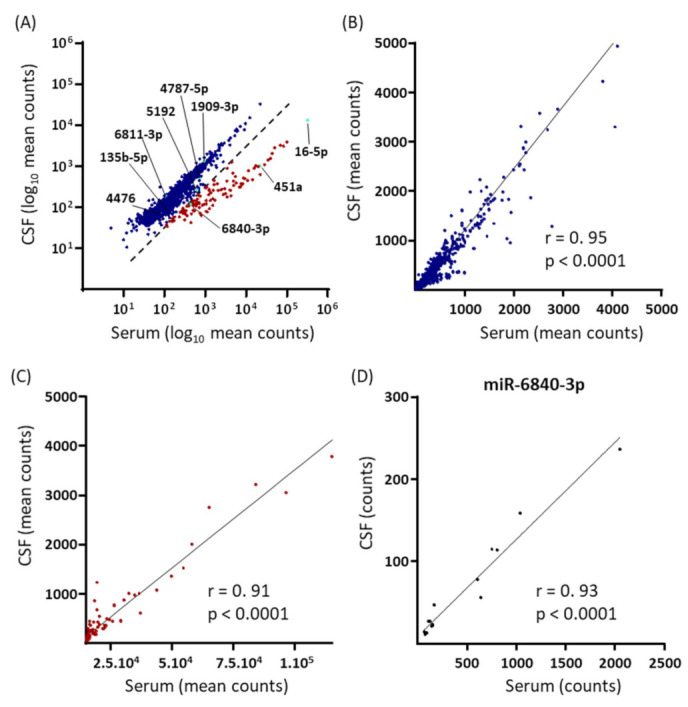
Figure 4.

Comparison of EV miRNome expression in matched serum and CSF samples collected from RRMS-relapse patients (n = 16). (A) Scatterplot of the log10 transformed mean normalized counts for each of the 2151 mature EV miRNAs quantified in both sample compartments. Two miRNA populations were visualized based on their serum–CSF associations. The dashed line indicates the qualitative best-fit-line of separation between the two miRNA populations. In the larger population, with data points depicted in blue, serum and CSF expression levels were similar. In the smaller population, with data points depicted in red, serum expression levels were high relative to CSF levels. The nine RRMS-relapse specific miRNAs are indicated in turquoise and identified. (B) Pearson’s product-moment correlation analysis of the linear normalized counts of serum vs. CSF miRNAs belonging to the larger miRNA population in A; 12 miRNAs lay outside the axis limits. (C) Pearson’s correlation analysis of the linear normalized counts of serum vs. CSF miRNAs belonging to the smaller miRNA population in A; 1 miRNA lays outside the axis limits. (D) Pearson’s correlation analysis of serum vs. CSF linear normalized counts for the RRMS-specific miR-6840-3p. Pearson’s correlation coefficients and p values are reported in the graph.
