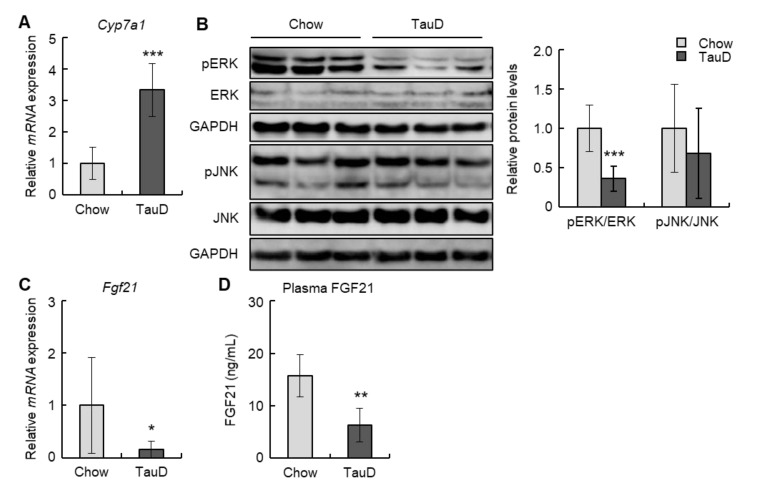
Figure 2.
Taurine downregulated FGF21/ERK pathway and upregulated Cyp7a1 transcription in the liver: (A) The expression of Cyp7a1 mRNA in the liver was analyzed by real-time RT-PCR (n = 6). (B) Total protein extracted from the liver was analyzed by immunoblotting using the shown antibodies (n = 6). The left panels show representative images. The right graphs show quantitative data. GAPDH was used as a loading control. (C) The expression of Fgf21 mRNA in the liver was analyzed by real-time RT-PCR (n = 6). (D) Plasma FGF21 was quantified using ELISA (n = 6). Data of real-time RT-PCR were normalized to Tbp levels. Values represent means ± SD. Differences between values were statistically evaluated by Student’s t-test. * p < 0.05, ** p < 0.01, *** p < 0.001 vs. Chow.

